
Abstract
Counterfeiting costs governments and private industries billions of dollars annually due to loss of value in currency and other printed items. This research involves using lanthanide doped β-NaYF4 nanoparticles for security printing applications. Inks comprised of Yb3+/Er3+ and Yb3+/Tm3+ doped β-NaYF4 nanoparticles with oleic acid as the capping agent in toluene and methyl benzoate with poly(methyl methacrylate) (PMMA) as the binding agent were used to print quick response (QR) codes. The QR codes were made using an AutoCAD file and printed with Optomec direct-write aerosol jetting®. The printed QR codes are invisible under ambient lighting conditions, but are readable using a near-IR laser, and were successfully scanned using a smart phone. This research demonstrates that QR codes, which have been used primarily for information sharing applications, can also be used for security purposes. Higher levels of security were achieved by printing both green and blue upconverting inks, based on combinations of Er3+/Yb3+ and Tm3+/Yb3+, respectively, in a single QR code. The near-infrared (NIR)-to-visible upconversion luminescence properties of the two-ink QR codes were analyzed, including the influence of NIR excitation power density on perceived color, in term of the CIE 1931 chromaticity index. It was also shown that this security ink can be optimized for line width, thickness and stability on different substrates.
Export citation and abstract BibTeX RIS
1. Introduction
Recent publications have highlighted the potential application of lanthanide doped nanoparticles in security printing [1–4]. Several of these studies focus on the use of nanoscale versions of traditional phosphors, such as Y2O3, YVO4, and CePO4 doped with red-emitting Eu3+ and green-emitting Tb3+ [1, 2]. These phosphors are based on a so-called 'downconversion' process, in which short-wavelength UV light is used to excite longer-wavelength visible emission. The vast majority of organic and inorganic phosphors currently in use fall into this category. It has also been reported, however, that lanthanide doped nanophosphors based on the phenomenon of 'upconversion' luminescence may be employed for security printing [3, 4]. Upconversion luminescence refers to emission produced at wavelengths shorter than the excitation light. In the case of NIR-to-visible upconversion, visible emission is produced using near-infrared (NIR) excitation. There are several potential advantages to the use of upconversion 'inks' in security printing as opposed to standard fluorescent inks, which typically produce visible emission upon UV excitation. First, both the upconversion inks and NIR excitation sources (or 'readers') are intrinsically more difficult to duplicate than standard fluorescent dyes and UV sources. Also, upconversion patterns can be written on highly fluorescent surfaces, since the NIR reader will not excite standard downconversion luminescence. Moreover, upconversion inks can be formulated to produce the correct color rendering only under specific excitation power densities, making it even more difficult to duplicate the correct read conditions.
Kim et al have produced predefined patterns of upconversion nanophosphors using a multi-step photolithography technique [3]. This process involved spin casting a composite film containing α-NaYF4:Yb3+, Er 3+ and α-NaYF4:Yb3+, Tm 3+ nanocrystals as green and blue upconverters, respectively. This is followed by photo-patterning through a mask, heat-treatment, and, finally, chemical development in which the non-exposed portions of the film are removed.
Subsequently, Blumenthal et al demonstrated a one-step printing process based on upconversion inks composed of β-NaYF4:Yb3+, Er 3+ nanoparticles in a polymer matrix. Well-articulated geometric shapes and letters were produced on multiple surface types using a screen-printing process, as well as an AutoCAD controlled direct-write process. Printed features on paper were essentially invisible under ambient lighting, but produced easily read, green luminescent images under NIR excitation. No pre- or post-processing of the substrate or printed image was required, and actual printers were used to create the images.
In the current study, we extend the work of Blumenthal and demonstrate the one-step printing of covert quick response (QR) codes using composite inks activated with lanthanide doped nanoparticles (β-NaYF4:Yb3+, Er 3+ and β-NaYF4:Yb3+, Tm 3+).
A QR code is a two-dimensional barcode, invented in 1994 by Denso Wave, with the main objective being a code that is easily readable [5, 6]. QR codes, or any 2D matrix codes, can hold 100 × more data than a traditional barcode, because of their horizontal and vertical scalability [7]. The information encoded can be made up of any kind of data (e.g., binary, alphanumeric, or Kanji symbols) [5, 6]. Data are accessed by scanning the QR code with the camera built into a smart phone and processing the image with a QR code scanner application. These matrix bar codes have rapidly gained international popularity and are now very commonly used in various products, because of fast readability and large storage capacity [5, 6, 8]. QR codes are typically used for authentication and tracking information, but not in security applications. We suggest that covert QR codes have the potential for application in security printing, and they are the focus of the current study. Herein, we demonstrate the printing of QR codes which are invisible on paper and transparent tape, but produce single- and multi-color upconversion luminescence images under NIR excitation which can be read and decoded with an unmodified smart phone.
2. Materials and ink formulation
2.1. Materials
Erbium oxide, ytterbium oxide and thulium oxide were obtained from Trona. Yttrium oxide (99.9%), oleic acid (90%) and 1-octadecene (90%), were obtained from Alfa Aesar. Acetic acid (glacial, 99.9%) was from Pharm Co. Toluene (99.5%) was obtained from Sigma-Aldrich. Methyl benzoate (99%) was obtained from Acros Organics. Sodium fluoride ( > 99%) was obtained from Fischer Scientific. Poly(methyl methacrylate) beads were obtained from Scientific Polymer Products. Substrate bond paper was purchased from Southworth. All chemicals and materials were used as received [4].
Upconversion nanoparticles were synthesized using the method of Lin et al [25, 9]. The phase purity (hexagonal) of the particles was verified using powder XRD (Rigaku Ultima IV) by comparing the sample diffraction pattern to the ICDD PDF card (16-334) for β-NaYF4. TEM (FEI Tecnai G2 Spirit) images showed that the nanocrystals exhibit a hexagonal shape, with a size of 60 ± 7 nm across the hexagonal face.
2.2. Ink formulation
Nanoparticles and poly(methyl methacrylate) beads were added to a solution of 90:10 v:v toluene:methyl benzoate. This optimal ink formulation was attained after carefully investigating the critical ink characteristics for printing, such as viscosity and surface tension [4]. The resulting mixture was then vigorously stirred for 3–4 h, followed by 10–20 min of sonication, to achieve complete dissolution of the polymer and dispersion of the nanoparticles [4].
2.2.1. Green upconversion fluorescence ink.
The green upconversion ink was comprised of β-NaYF4:17% Yb3+, 3% Er3+ nanoparticles with oleic acid as a capping agent. The nanoparticle samples, as synthesized, were composed of approximately 80 wt% oleic acid and 20 wt% doped NaYF4. The solvent portion of the ink was mainly toluene and methyl benzoate with dissolved poly(methyl methacrylate) (PMMA). The PMMA becomes a binding agent once the solvent evaporates after printing. These inks upconvert NIR to green (540 nm) and NIR to red (660 nm). The perceived color of these inks is green.
Green upconversion fluorescence ink with 2 wt% of upconverting nanoparticles, 1 wt% of PMMA in solvent mixture of 90:10 v:v toluene:methyl benzoate was used in printing QR codes.
2.2.2. Blue upconversion fluorescence ink.
The blue upconversion ink was comprised of β-NaYF4:25% Yb3+, 0.3% Tm3+ nanoparticles with oleic acid as capping agent. The nanoparticle samples (80 wt% oleic acid and 20 wt% NaYF4) were dispersed into a toluene and methyl benzoate solvent mixture with PMMA as binding agent. These inks upconvert 980 nm NIR excitation to (470, 475 nm) [9]. As discussed below, the perceived color of this ink depends somewhat on NIR excitation power, because the 475 nm emission (Tm3+: 1G4→3H6) is a three-photon process, whereas the 450 nm emission (Tm3+: 1D2→3F4) is a four-photon process.
Blue upconversion fluorescence ink with 3 wt% of upconverting nanoparticles, 1 wt% of PMMA in solvent mixture of 90:10 v:v toluene:methyl benzoate was used in printing the QR codes.
3. Experimental procedure
3.1. Producing the upconverting QR codes
As shown in the first portion of the flow chart in figure 1, a QR code was generated by entering the text 'SDSM&T' in the QR code generator [10]. Using the computer generated QR code, an AutoCAD dmc file was made using the scaling of the QR code image and transferred to the Optomec system. The scale of the image is very important as the decoding critically depends on the scale of the different black and white squares of the QR code. The QR code was deposited on a paper substrate using an Optomec aerosol jet printer®. The parameters used to print with the aerosol jet were sheath 125 ccm, atomizer 30 ccm and atomizer power 35 V. A nozzle size of 250 μm was used to deposit the QR code. It took approximately eight minutes to print a QR code of one pass with a deposition speed of 5 mm s−1 on the aerosol jet. QR code was printed with one pass (with a thickness approximately 1.5 μm) on the paper using upconverting ink with the Optomec aerosol jet®. Upconversion luminescence images of the QR code on the paper substrate were generated using NIR excitation light from an Opto Engine LLC MDL-H-980 nm infrared diode laser system. The power density used on the laser fiber probe was approximately 4.4 W cm−2. The image was captured photographically using a Nikon D3000 digital SLR with an AF-S DX Micro-NIKKOR 40 mm f/2.8G macro lens with a UV/IR filter. The exposure time was 15 s, aperture size used was f8 and ISO was 100. The upconversion image of the QR code was scanned using a code scanner application on a smart phone.
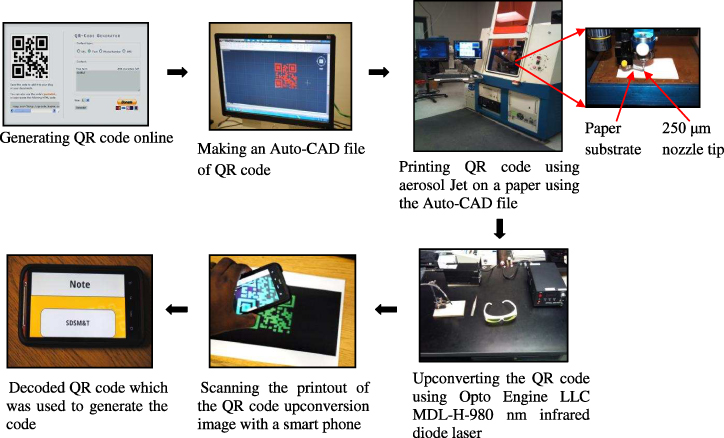
Figure 1. Flow chart of generating a QR code by a website, printing on a paper substrate using Optomec aerosol jet®, upconverting with NIR laser and scanning the upconverted image with a smart phone.
Download figure:
Standard image3.2. Spectroscopic characterization of the upconverting QR codes
Excitation of upconversion luminescence was provided by a 980 nm continuous-wave (CW) diode laser system (Thor Labs). Upconversion emission spectra were obtained from the printed features of the QR code using an excitation-power-density range of 4.0–5.5 W cm−2. Upconversion emission was collected and focused with an f-matching lens into a 1/3 m monochromator (Jobin-Yvon, Triax 320) equipped with a red-sensitive photomultiplier tube (Hamamatsu, R2658P). Luminescence signal was detected using a photon counting method. The photomultiplier signal was first pre-amplified (Stanford Research Systems, SR 445A) and then fed into a multichannel scalar (Stanford Research Systems, SR 430) for pulse counting. All spectra were corrected for instrument response.
4. Results and discussion
4.1. Upconverting QR code with green upconversion-fluorescence ink
Images of the standard QR code printed using conventional ink on paper and upconverting QR code are shown in figures 2(a) and (b) respectively. In figure 2(b), the letters 'U', 'S', and 'D' (University of South Dakota) in the upper-left, upper-right, and lower-left corners, respectively, of the upconversion QR code were written with two passes of the ink in order to make the upconversion brighter and more legible as a security feature. The remainder of the code was printed in a single pass.
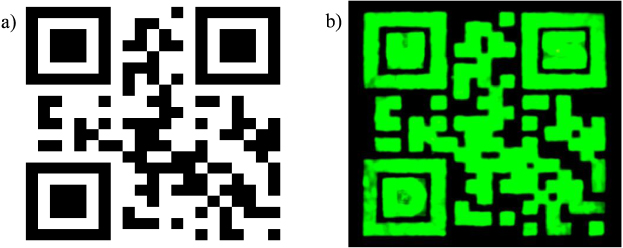
Figure 2. (a) Regular QR code of SDSM&T printed on paper by standard methods. (b) The covert luminescent upconversion image of the same QR code printed using an aerosol jet with the letters 'U', 'S', and 'D' (University of South Dakota) written in the upper-left, upper-right, and lower-left corners, respectively.
Download figure:
Standard imageThis QR code was read easily by a smart phone, even though the letters 'U', 'S', and 'D' have been added, and are brighter than the rest of the QR code. This result is not surprising, as QR codes with 30% error can be read easily by scanning equipment [5]. The entire procedure shown in figure 1 is straightforward and it took less than one and a half hours to generate and read the covert QR code. The 'invisible' QR codes required only 0.3–0.4 ml of ink per code. In addition, these QR codes can be printed on wide variety of substrates and require no post-print processing [4]. The substrates used so far for printing include paper, glass and Kapton®.
4.2. Thickness of the deposited upconverting ink (one pass)
SEM images were obtained to determine the thickness of one pass of the upconverting ink printed on glass and paper substrates. The thickness on glass was measured to be about 1.5 μm, as shown in figure 3(a). However, when one pass was printed on paper, a well-defined layer was not obtained as shown in figure 3(b), as the roughness of the paper is more than the thickness of one pass. In other words, given the roughness of paper substrate the concept of traditional layer thickness is not easily defined.
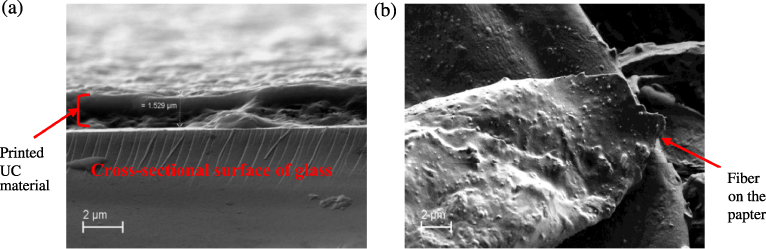
Figure 3. (a) SEM micrograph of the cross section of one pass of ink on a glass slide. (b) SEM micrograph of top view of the upconverting ink printed on paper.
Download figure:
Standard image4.3. Adding security features to QR codes using green and blue upconverting ink
The addition of the letters 'U', 'S', and 'D' in the previous QR code demonstrates that multiple levels of security can be embedded within the covert QR codes without interfering with the ability to read the coded information. Letters or symbols, ranging from macroscopic to microscopic, can be embedded within the QR code using different colored inks. Therefore, NIR light can be used to verify visual security features based on added symbols and/or color. The QR code shown in figure 4 contains both types of added feature.

Figure 4. Upconverting image of QR code of 'SDSM&T' which has the literal text 'USD'; 'U', 'S', and 'D'; and 'SD' inserted in the code image with blue upconverting ink as indicated above.
Download figure:
Standard imageFigure 4 shows the upconversion luminescent image of the same QR code as in figure 2(b), except that visual security features have been added using both green and blue upconverting inks. The blue upconversion is less intense than green, because blue emission results from a three-photon process and a four-photon process, whereas a two-photon process generates green emission (see figure 5).
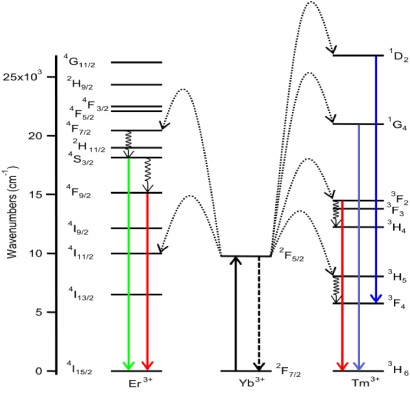
Figure 5. Energy level diagram showing the NIR-to-visible upconversion process for Yb3+ /Er3+ and Yb3+/Tm3+ co-doped β-NaYF4. Reprinted with permission from [30]. Copyright 2006 Elsevier.
Download figure:
Standard imageThe luminescent QR code in figure 4 exhibits three distinctly different colors (green, light blue and blue) and employs two sizes of lettering. The color variations were achieved using two separate AutoCAD files for the green and blue regions. Blue-color regions have the same home point as green so that the aerosol jet will correctly print the full code. First, green ink was printed by selecting the first AutoCAD file. Then, the green-ink vial was replaced with the blue-ink vial and the second AutoCAD file was selected to print the blue region.
The locations of the first (larger) and second (smaller) set of the letters 'U', 'S', and 'D' in blue are indicated with arrows and shown in magnified images in figure 4. The green areas were printed by an ink with 2 wt% of nanoparticles and 1 wt% of PMMA. Blue regions were printed using an ink with 3 wt% of nanoparticles and 1 wt% of PMMA. Both were printed with two passes. As previously mentioned, even with all the extra features printed in the code, the covert code was easily read by a smart phone. The difference between the two hues of blue observed in figure 4 originates from the blue ink printed on the bare substrate relative to that printed over the green ink. These color variations are analyzed spectroscopically below. It can be concluded that QR codes with different colored upconverting inks and embedded characters written within the code provide an additional effective level of security.
4.4. Spectroscopic characterization of the luminescent QR code images
The most well-studied NIR-to-visible upconversion nanocrystals are based on the Ln3+ doped β-NaYF4 lattice, wherein Yb3+ is used as a sensitizer, absorbing 980 nm excitation light, and either Er 3+ or Tm3+ is used as the visible activator [11, 12]. These materials are among the most efficient upconverters known, and a variety of synthetic methods have been described for producing solvent-dispersible nanoparticles with controlled size, shape and capping ligand [13–29]. The NIR-to-visible upconversion process for Yb3+/Er 3+ and Yb3+/Tm 3+ co-doped β-NaYF4, which are the activators in our 'green' and 'blue' inks, respectively, is shown schematically in figure 5.
In both upconversion systems, Yb3+ is excited to the 2F5/2 state by 980 nm NIR excitation, and the visible-light-emitting states of Tm3+ and Er3+ are populated by consecutive non-radiative energy transfer events from excited Yb3+ ions. For β-NaYF4:Yb3+, Er 3+, green and red emission is observed, corresponding to the 2H11/2, 4S3/2→2I15/2 and 4F9/2→2I15/2 transitions of Er3+, respectively. For β-NaYF4:Yb3+, Tm 3+, blue emission is observed, due to the 1G4→3H6 and 1D2→3F4 transitions of Tm3+. The upconversion mechanisms illustrated in figure 5 are described elsewhere in detail [30].
Visible upconversion emission spectra were acquired, as a function of NIR excitation power density, from the various printed regions of the QR code shown in figure 4. The purpose of these measurements was to characterize the CIE chromaticity coordinates of the variously colored regions of the luminescent image, and how these coordinates, and therefore the perceived color, change with excitation power density.
The luminescence spectra of the blue-ink-only and blue-ink-on-green-ink features of the QR code (figure 4) as a function of excitation power density are shown in figures 6 and 7, respectively. The areas of the printed QR code from which the spectra were obtained are marked in the upper portion of figure 8.
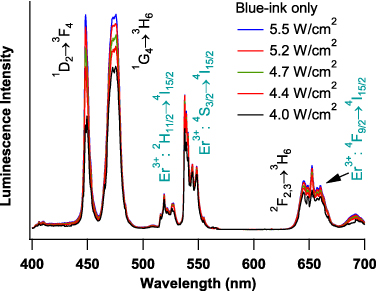
Figure 6. Visible upconversion luminescence spectra, as a function of 980 nm excitation power density, of a blue-ink print region of the QR code in figure 4. Peaks are assigned to Tm3+ transitions according to the energy level diagrams in figure 5. Er3+ emission is also observed due primarily to residual green ink in the print head. The relative contributions of 'pure' blue emission from the 1D2→3F4 and 1G4→3H6 transitions of Tm3+ increase with increasing excitation power density.
Download figure:
Standard image
Figure 7. Visible upconversion luminescence spectra, as a function of 980 nm excitation power density, of a blue-ink-on-green-ink print region of the QR code in figure 4. Peaks are assigned to Tm3+ and Er3+ transitions according to the energy level diagrams in figure 5. The relative contributions of 'pure' blue emission from the 1D2→3F4 and 1G4→3H6 transitions of Tm3+ increase with increasing excitation power density.
Download figure:
Standard image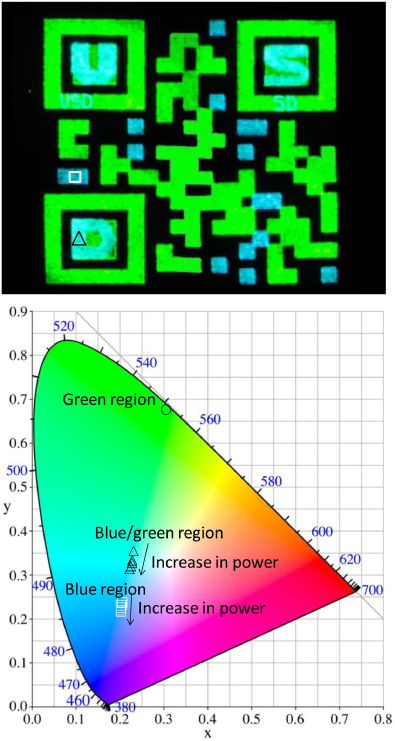
Figure 8. (Upper) Upconversion luminescent image of QR code indicating the specific areas from which the spectra of the blue ink (white square) and blue-ink-on-green-ink (black triangle), shown in figures 6 and 7, respectively, were obtained. (Lower) CIE 1931 chromaticity diagram indicating the positions of the blue-ink (white squares) and blue-ink-on-green-ink (black triangles) emission as a function of 980 nm excitation power density. The coordinates were obtained from the spectra in figures 6 and 7.
Download figure:
Standard imageWe have previously characterized the emission properties of printed features of the green ink, and the reader is referred to [2] for a full description. Briefly, the perceived green color changes very little over the power densities used, with the CIE coordinates remaining close to (0.31, 0.67), as marked with an open circle in the lower section of figure 8.
Figure 6 shows the spectra for a blue-ink-only area of the QR code. The specific area of the printed code from which the spectra were acquired is marked with a white square in the upper section of figure 8. Peaks are assigned to Tm3+ transitions according to the energy level diagrams in figure 5. Er3+ emission is also observed, due primarily to residual green ink in the print head. The relative contribution of 'pure' blue emission, corresponding to the 1D2→3F4 and 1G4→3H6 transitions of Tm3+, increases with increasing excitation power density. As mentioned previously, the blue emission is more sensitive to excitation power density than the green/red emission, because the blue emission arises from a higher-order-photon process (see figure 5). Note also that the 450 nm emission (a four-photon process) increases more rapidly with increasing excitation power density than the 475 nm emission (a three-photon process). As a result of these two factors, the perceived color of luminescence from this print area will be power dependent.
To characterize the evolution of color emitted from the blue-print areas as a function of excitation power, each of the spectra in figure 6 were converted to x,y coordinates on the CIE 1931 chromaticity diagram, as illustrated in the lower segment of figure 8 (open white squares). The color change over the power densities used is relatively subtle, shifting from a lighter to a deeper blue with increasing power.
Figure 7 shows the spectra for a blue-ink-on-green-ink area of the QR code. The specific area of the printed code from which the spectra were acquired is marked with a black triangle in the upper section of figure 8. Peaks are assigned to Tm3+ and Er3+ transitions according to the energy level diagrams in figure 5. The spectra look similar to those obtained from the blue-ink-only area (figure 4), except that the Er3+ emission is relatively stronger. Each of the spectra in figure 6 were converted to x,y coordinates on the CIE 1931 chromaticity diagram, as illustrated in the lower segment of figure 8 (open white squares). The color change over the power densities used, in this case, is easily noticeable, shifting from a blue–green at low powers to a light blue at higher powers.
It is not surprising that emission from the green ink is clearly observed from beneath the blue-ink layer of the blue-ink-on-green-ink areas of the printed code. The optical density of a given layer of ink, in both the visible and NIR regions, is extremely low, due to the fact that the absorbance cross sections of the Ln3+ transitions are intrinsically low, and that the optical path lengths are very short. This offers flexibility in color control in terms of layering different inks and/or modifying the nanoparticle density within the inks.
4.5. Appliqué security codes
All of the printing demonstrated to this point has been on paper. However, the methods and ink formulation are amenable to other substrates. For example, covert QR codes were printed on regular, transparent office tape and attached to a paper magazine label in an appliqué fashion, as shown in figure 9. This method holds promise for a very robust approach for routine security printing for a wide variety of documents and products.
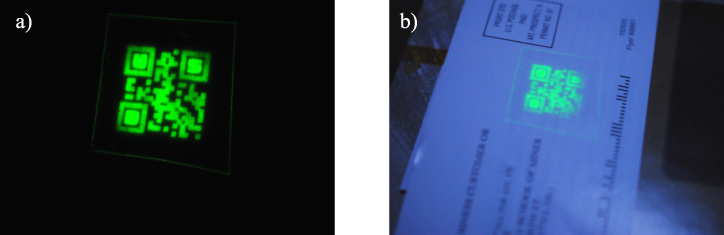
Figure 9. (a) Upconversion image of the covert QR code on a transparent tape. (b) Upconversion image of the QR code on transparent tape affixed to the label of a magazine.
Download figure:
Standard image4.6. Stability test of the ink on paper
The covert QR code was tested for mechanical stability of the ink on a paper substrate, see figure 10. The paper containing the covert code was subjected to 50 random direction foldings and the upconversion and the readability of the QR code printed on the paper was determined, as shown in figures 10(c) and 10(d) respectively. It was found that the covert QR code was easily read by a smart phone, even after 50 foldings. This illustrates the robustness of the QR codes with respect to error accommodation.
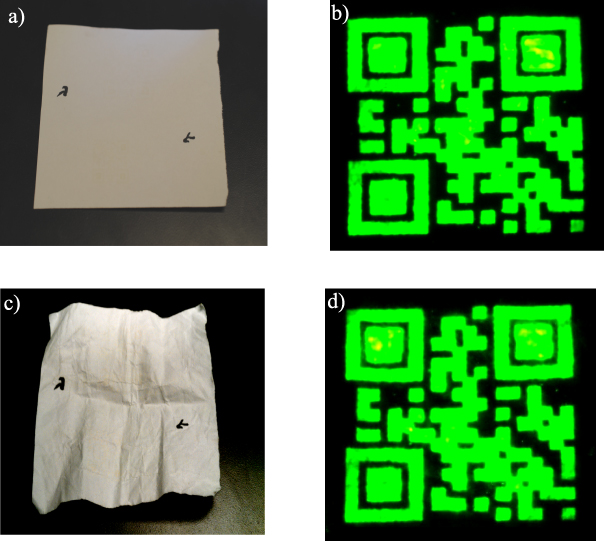
Figure 10. (a) Image of the ink deposited on paper before folding. (b) Initial upconversion image before folding the paper. (c) Image of the paper after folding 50 times. (d) Upconversion image after 50 times folding the paper.
Download figure:
Standard image5. Conclusion
Upconverting inks were successfully applied to print QR codes on paper and transparent tape, using an aerosol jet direct writing machine. QR codes with embedded security characters were produced using blue and green upconverting inks. The QR images were essentially invisible, and certainly unreadable, in ambient lighting conditions. Visible luminescent upconversion images of the QR codes were achieved by illumination with a 980 nm, continuous-wave laser. Upconversion images of the QR codes were successfully read using a smart phone QR code application. Visible upconversion spectra from various areas of a QR code printed with blue and green inks, including areas with overlapping inks, were acquired and analyzed in terms of their corresponding coordinates on a CIE 1931 chromaticity diagram. The effect of excitation power density on color was analyzed. Mechanical stability testing was performed on the upconverting QR code printed on paper.
We suggest these covert QR codes could be used economically and efficiently in security printing. The inks are produced from inexpensive starting materials, and very small amounts of ink are required to produce readable images. Multi-colored QR codes can be produced using various ink combinations and a single excitation wavelength [12, 30]. New inks are currently being optimized for mechanical stability and improved color control in order to improve the security features in the QR codes.
Acknowledgments
This material is based upon work supported by the National Science Foundation/EPSCoR grant No 0903804 and by the state of South Dakota. Q-AL was supported by an NSF-IGERT award (DGE 0903685). Additional support to PSM was provided by the National Aeronautics and Space Administration (cooperative agreement number: NNX10AN34A). Instruments used for TEM and XRD measurements were obtained through NSF grants CHE 0840507 and CHE 0722632.