

Abstract
Over recent decades, the retreat of Kilimanjaro's glaciers has been portrayed as a beacon of climate change. The decline of glaciers over the 20th century, however, is evident for all tropical glaciers in East Africa, including those found on Mount Kenya and in the Rwenzori Range. More recent studies have focused on Kilimanjaro and Mount Kenya but the Rwenzori Range has not been considered for nearly two decades, which introduces an uncertainty about the remaining glacierization in East Africa. Therefore, the present study provides insights into the most recent glacier extents of all three mountain regions using a manual, multitemporal analysis of high-resolution satellite images for the years 2021/2022. The glacierization in East Africa is estimated to be 1.36 km2, with a glacier area of 0.98 km2 on Kilimanjaro, 0.069 km2 on Mount Kenya and 0.38 km2 in the Rwenzori Range. The uncertainty is determined to be within 12.5%. Compared to previous estimations, the overall area has declined by more than a half of its early 21st century extent. Being mainly controlled by high-altitude hygric seasonality, these glaciers are particularly valuable indicators of tropical climate variability and climate change.
Export citation and abstract BibTeX RIS

Original content from this work may be used under the terms of the Creative Commons Attribution 4.0 license. Any further distribution of this work must maintain attribution to the author(s) and the title of the work, journal citation and DOI.
1. Introduction
Over the past ∼20 years, tropical glaciers have been recognized as being particularly valuable indicators of climate variability and climate change. Recent studies show that tropical glacier retreat in the Andes is in the order of the average global retreat rates (Hugonnet et al 2021) or even stronger (Zemp et al 2019). Not only does the high-elevation location of tropical glaciers provide a climatic signal from an understudied region of the tropical atmosphere, their strong sensitivity to various climate variables (in addition to local air temperature) also enables a more complete understanding of tropical high-altitude environmental change (e.g. Kaser 1999, Wagnon et al 2001, Mölg et al 2003a, 2009a, Kaser et al 2004, Sicart et al 2008, Hastenrath 2010, Prinz et al 2016, Autin et al 2023). Another interesting scientific aspect concerns the fact that glaciers respond to local, meso- and large-scale climate dynamics (e.g. Mölg et al 2012); therefore, tropical glacier changes allow us to derive climate change aspects of the thermally homogeneous tropical midtroposphere from a multi-scale mechanistic viewpoint (Mölg et al 2009a, 2012). Globally, three high mountain regions have contained tropical glaciers in recent centuries: the South American Andes, the Indonesian Sudirman Range and the three highest massifs in East Africa (Hastenrath 1984, Kaser and Osmaston 2002, Klein and Kincaid 2006). All tropical glaciers have in common that they are situated near the Equator and inside the astronomic tropics, and are therefore influenced by the Intertropical Convergence Zone. This induces rainy and dry seasons, whereas the annual cycle of air temperature is smaller than the diurnal cycle (Kaser 1999). While virtually all of the 2341.04 km2 estimated global tropical glacier surface area (for the year 2000) were located in the Andes, only 2.12 km2 were within the Sudirman Range and 4.41 km2 in East Africa, according to the Randolph Glacier Inventory (RGI) 7.0 from 2023 (RGI Consortium 2023).
The climatic environment of the tropical East African glaciers on Kilimanjaro (5,985 m) [3°04ʹ S, 37°21ʹ E], Mount Kenya (5,199 m) [0°09ʹ S, 37°18ʹ E] and the Rwenzori Range (5,109 m) [0°23ʹ N, 29°52ʹ E] (figure 1) is mainly controlled by the hygric seasonality of the regions and its corresponding influences (e.g. Hastenrath 1984, Mölg et al 2003b, Nicholson et al 2013). The associated precipitation distribution in East Africa is defined by a 'long' rainy season in March, April and May and a 'short' rainy season from October/November to December (e.g. Indeje et al 2000). They are separated by a dry season with trade wind influence, which is less pronounced in the Rwenzori Range due to additional boreal summer rains (Kaser 1999, Nicholson 2017). The other two mountains show a clear bimodal precipitation distribution and for example 70%–80% of the yearly precipitation on Kilimanjaro's summit occurs during the rainy seasons (Mölg et al 2009a). One crucial moisture source lies in the Indian Ocean and is affected by its dynamics and anomalies (Chan et al 2008, Collier et al 2018). In particular, the Indian Ocean Dipole Mode (Webster et al 1999) and its occurrence determines whether there is more (positive dipole) or less (negative dipole) precipitation in East Africa interannually, which additionally seems to be connected to the El Niño Southern Oscillation (e.g. Ihara et al 2008).

Figure 1. Overview of the glacierized high mountain regions of East Africa and their mean annual summit precipitation (data from Nicholson et al 2013; Esri base map).
Download figure:
Standard image High-resolution imageSolid precipitation is responsible for the accumulation in the glacier's mass balance, and a fresh snow cover also protects the glacier surface from incoming radiation and induces a strong albedo effect, which is vital for reducing ablation (i.e. mass loss) (e.g. Wagnon et al 2001, Francou et al 2003, Mölg and Hardy 2004). Cloud cover may have the effect of blocking solar radiation, but can also lead to an increase in longwave radiation (Francou et al 2003, Nicholson et al 2013, Prinz and Mölg 2020). Therefore, the convective cloudiness dynamics of the regions strongly impact the amount of radiation on the glaciers (Mölg et al 2003b). Kilimanjaro shows an additional complexity in terms of mechanisms, due to the existence of near-vertical ice cliffs on parts of the margins of the local glaciers (on the summit plateau). These features are governed by the solar radiation geometry, leading to an annual cycle in lateral ablation on the cliffs through melting and sublimation (Mölg et al 2003a, Kaser et al 2004, 2010, Winkler et al 2010). Both the general (e.g. albedo effect) and special processes (at ice cliffs) underscore the importance of solar radiation and moisture levels for glacier mass and volume variability in East Africa, from the seasonal to the climatological time scale.
A central effort to investigate the recession of tropical glaciers has concerned the assemblage of glacier surface areas and their variation over time (e.g. Kaser 1999). The modern retreat of the tropical glaciers in East Africa started at the end of the 19th century, when a 'switch' from a moist climate towards drier conditions occurred (Hastenrath 2001, Mölg et al 2003b, 2009a, Kaser et al 2010, Prinz et al 2016). This switch was most likely driven by changing properties of dipole mode events in the Indian Ocean, which reduced the atmospheric moisture and precipitation in East Africa (Ihara et al 2008, Thielke and Mölg 2019). The first well-documented glacier surface area measurements by early scientific expeditions date back to around 1900. In 1912 the glacier area on Kilimanjaro constituted 11.40 km2, 1.64 km2 on Mount Kenya in 1899 and 6.51 km2 in the Rwenzori Range in 1906 (Hastenrath 2005, Kaser and Osmaston 2002, Cullen et al 2013, Prinz et al 2018). It has been demonstrated that the glaciers in all three regions have lost more than 80% of their ∼1900 extent over the 20th century (Prinz and Mölg 2020). Accordingly, the latest estimates defined an overall area of about 3 km2, with 1.762 km2 located on Kilimanjaro in 2011, 0.154 km2 on Mount Kenya in 2016 and 1.14 km2 in the Rwenzori Range in 2005 (Mölg et al 2006, Cullen et al 2013, Prinz et al 2018). As many years have passed and a continued tropical glacier decline with severe consequences on local environments have been observed elsewhere (e.g. Rabatel et al 2013), it seems timely to update all East African glacier extents to the most recent years. Additionally, there is a rather large discrepancy in the amount of research within the regions. For example, while Lewis Glacier on Mount Kenya belongs to the best studied tropical glaciers outside the South American Andes (e.g. Hastenrath 1984, 2005, Prinz et al 2016), the glaciers of the Ruwenzori Range have not been a climatological research focus for more than a decade, besides individual estimates of the Stanley Plateau glacier extent in 2012 within studies on glacial biological communities (Uetake et al 2022). Since all other tropical glaciers underwent a strong decrease in areal extent over the 21st century, it is likely that the small tropical glaciers of East Africa decreased substantially since the last estimates (see above) that were also summarized by Prinz and Mölg (2020). In this context, the aim of this paper is to update the time series of glacier extent in the three East African high mountain regions: Kilimanjaro, Mount Kenya and the Rwenzori Range.
2. Data and methods
Traditional remote sensing techniques are especially well-suited for large areas, whereas the spatial resolution for the detection of small (<0.1 km2) tropical glaciers needs to be high (Prinz et al 2018). To access free, high-resolution satellite data that allows a detailed investigation, the private provider Planet Labs with its PlanetScope program has been selected. Their CubeSat 3 U 'Dove satellites' contain one of three imagers that record multispectral visible and near infrared bands (Planet Labs 2022a). The images of the chosen PlanetScope OrthoTile Products reach a horizontal resolution of 3.125 m, cover an area of 25 × 25 km2 and are already orthorectified, as well as adjusted to the Universal Transverse Mercator (UTM) grid (Planet Labs 2022a, 2022b). We examined the archives from March 2022 back to 2019 for Kilimanjaro, and to 2020 for Mount Kenya and the Rwenzori Range, depending on the availability of suitable images. Within this period, images had to meet several criteria for the quality of the selection that will be introduced further.
First and foremost, the images should be as current as possible. The daily return rate of the Planet Labs satellites enabled us to select images of high quality, which are minimally affected by cloudiness, moisture content in the air and snow cover on the mountains. However, the lighting conditions are a further difficulty in the high mountain terrain varying significantly depending on the sun elevation at the time of acquisition. We selected three main reference images for our analysis: (1) an image of Kilimanjaro from November 2021, (2) an image of Mount Kenya from June 2021, and (3) an image of the Rwenzori Range from January 2022 (table 1). We also selected additional (supplementary) images for each of the regions, with different (yet recent) acquisition dates and times, to support identification of the glacier areas (table S1). The supplementary images allowed us to distinguish areas of snow from glacier ice more clearly and to examine issues of shading in more detail.
Table 1. Metadata of the PlanetScope satellite images of Kilimanjaro, Mount Kenya and the Rwenzori Range with local time UTC +3 (Planet Labs 2022c).
| Kilimanjaro | Mount Kenya | Rwenzori | ||||
|---|---|---|---|---|---|---|
| Acquisition date | 19.11.2021 04:52:10 UTC | 22.06.2021 08:02:08 UTC | 12.01.2022 07:59:07 UTC | |||
| Product type | PSOrthoTile | PSOrthoTile | PSOrthoTile | |||
| Product name | 5109160_3737607_2021-11-19_1052 | 4611756_3739007_2021-06-22_1063 | 5281133_3539228_2022-01-12_1011 | |||
| ID | 34f27471-ec6a-4791-b33d-c0ef4e13a54b | 3b7a162c-b371-4f67-b4c2-c229df41e6da | ef4e56fe-d445-42fa-a6e5-6d19bb74ea69 | |||
| Coordinates | ||||||

| 03.04400° S | 00.14400° S | 00.34800° S | |||
| 37.33000° E | 37.38000° E | 37.29700° E | 37.31900° E | 29.86300° E | 29.90900° E | |
| 03.09400° S | 00.16100° S | 00.40900° S | ||||
The methodological approach of the investigation of glacier extent is manual detection of ice body margins, using ArcGIS Pro. An automatic procedure could not deliver a detailed and reliable result because of the above-mentioned illumination and snow artifacts. In any case, a visual verification would have been required to reduce the uncertainties, which is now directly included within the manual detection (e.g. Paul et al 2013). For the delineation of the glacier margins, the visual bands as RGB true color images were analyzed without further contrast enhancement, as the chosen PlanetScope image product was explicitly preprocessed for visual analysis (Planet Labs 2022a).
The process of outlining the glacier area already implies uncertainties regarding the individual allocation of pixels, despite the high resolution of the images. Accordingly, we performed three types of detection that included a minimum, a primary and a maximum extent, to indicate the range of probable glacier areas (e.g. figure 2). The minimum and maximum extent are used to describe the inner- and outermost range of glacier extent, whereas the primary extent represents the most likely glacier area. The minimum extent is defined by the sharp transition of a homogeneous pixel pattern (i.e. bright) of the glacier to the surrounding mixed pixels. The maximum extent includes all mixed pixels that differ from the surrounding ground pixel pattern (i.e. dark) and the regions where classification is unclear because of shading. This extent most likely includes minor snow patches, and is the maximum (and probably overestimated) glacier extent. Since the information of the mixed pixels is likely to partially include glacial area, our so-called primary extent represents the most accurate estimate of glacier area. The uncertainty is then expressed as the average percent deviation of the primary extent (Aprim) from the minimum (Amin) and maximum (Amax) extents, i.e. the mean of  and
and  . This approach provides us with a range for glacier area that accounts for image resolution and quality.
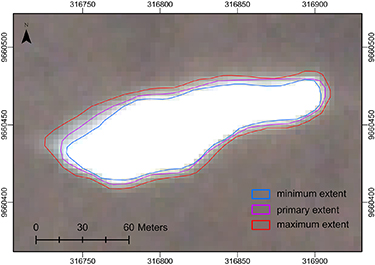
Figure 2. Different types of manual detection of the glacier extent; exemplary for the Furtwängler Glacier on the summit plateau of Kilimanjaro.
Download figure:
Standard image High-resolution imageIn the first step of the identification of glacier area, the main reference images and the supplementary images were compared to the former glacier outlines of Kaser and Osmaston (2002), Cullen et al (2013) and Prinz et al (2018). Bright pixels (areas) at the positions of the former glacier extents, which do not appear in all images, are declared as snow patches and excluded from the detection. If snow detected on the main images disagreed with the glacier outlines of the other images, the extents observed on the alternative images were used to determine glacier area—because recent expansion of these glaciers has not been documented. The delineation of the glacier outlines was performed in scale range of 1:1000 to 1:1500, depending on the size of the glaciers and the image conditions. With all individual glaciers being smaller than 1 km2, the overall digitalization uncertainty is expected to be between 1%–15% (Paul et al 2013).
All three regions have been investigated according to this approach and evaluated regarding the described image quality criteria. In addition, we used our extensive archive of photography from field expeditions and the observations and knowledge gained from field work (in all three mountains) by our author team. The most recent photos available to us are from February 2020 on Kilimanjaro, September 2018 on Mount Kenya and January 2022 in the Rwenzori Range.
Generally, the precision of the orthorectification of the Planet Labs images contained a mismatch of roughly 50 m between the alternative images, which had to be adjusted. This mismatch might be due to an inadequate digital elevation model for orthorectification. Thus, additional georeferencing was necessary and prominent topographic features, e.g. mountain peaks, have been used to align the different images. We additionally compared the new geolocation with the second band of Sentinel-2 images with 10 m spatial resolution to confirm the adjustments for each region.
3. Results
The detected glacier extents of all the three regions show a considerable and continuing loss of glacier area. Based on the satellite images of 2021 and 2022, the area of tropical glaciers in East Africa has shrunk to 1.36 km2. This result exhibits a substantial discrepancy to the last estimates of the RGI from 2000, which states an area of 4.41 km2 (e.g. RGI 7.0 Consortium 2023) and even to the latest research of an area of 3 km2 (see Cullen et al 2013 for Kilimanjaro, Mölg et al 2006 for the Rwenzori Range, Prinz et al 2018 for Mount Kenya). Our glacier extent is constrained by the minimum estimate of 1.20 km2 and the maximum extent of 1.54 km2; the glacier surface area lies within ±12.5% uncertainty, which is in the uncertainty range for manual detection stated by Paul et al (2013). Despite the rather conservative approach to determining the maximum extent, the area loss would still be slightly more than half of the last assessments (3 km2, see above).
In the following, each region will be presented separately in the order Kilimanjaro, Mount Kenya and Rwenzori Range. The nomenclature of the glaciers is based on the maps and tables of Hastenrath (1984), Cullen et al (2013) and Prinz et al (2018).
3.1. Kilimanjaro
Kilimanjaro possesses most of the East African glacier area. While the extent in 1912 was mapped as 11.4 km2, the remaining glacier area in November 2021 was only 0.98 km2 (figure 3). Over the last century, all glaciers on Kilimanjaro have been retreating and some have vanished completely. The areal reduction since the last estimation in 2011 of 1.76 km2 (Cullen et al 2013) reveals a loss of 0.78 km2 within ten years and a change rate of −7.81 × 10⁴ m2 yr−1. While the retreat of the glaciers is generally driven by the reduction and variability of precipitation on the summit (Mölg et al 2009a), at least two glacier regimes can be distinguished owing to their location and orientation on Kilimanjaro—the slope glaciers and the plateau's ice fields (Kaser et al 2004, Cullen et al 2006). The plateau glaciers, containing the tabular-shaped ice fields with their ice cliffs (see section 1), account for most of the glacier area on Kilimanjaro (0.6 km2), followed by the southern slope glaciers with 0.24 km2 extent and the western slope glaciers with 0.14 km2 extent (see the supplementary table S2 and figure S1 for details).

Figure 3. Glacier extents on Kilimanjaro between 1912 until 2021. Adapted from Cullen et al (2013). CC BY 3.0.
Download figure:
Standard image High-resolution imageBesides the difference in elevation, a distinct retreat since the last mapping is evident for the Southern Ice Field (SIF) and the Kersten Glacier, which has resulted in an area loss of approximately 59% for the SIF and 54% for the Kersten glacier since 2011.
Another retreat pattern is characterized by the formation and further development of notches at the outer ice margins. It is particularly advanced, for instance, for the Eastern Ice Field. Furthermore, it led to the final separation of the Northern Ice Field (NIF) into two distinct parts sometime after June 2011 (Cullen et al 2013).
Regarding the largest remaining ice entity, the most pronounced areal retreat of the NIF is seen on the western sides (figure 3), which indicates that processes other than solar radiation matter locally (see above and, e.g. Bohleber et al 2017). This area loss reduced the remaining glacial extent of the NIF to 0.6 km2, separated into the remnants of the Credner Glacier (Northern part) which covers 0.19 km2 and the Drygalski Glacier (Southern part) with 0.41 km2. It is, furthermore, noteworthy that pronounced retreat appears to have led to the disappearance of the Arrow, Uhlig and the Western part of the Great Barranco glaciers (figure 3). Field observations are still required to confirm this, given how small these remaining ice fragments might be if still present.
3.2. Mount Kenya
The glaciers on Mount Kenya lost more than half of their 2016 extent by 2021/2022. Maintaining the smallest amount of glacier area in East Africa, the extent has shrunk from 0.15 km2 (Prinz et al 2018) to 0.069 km2 (figure 4). Within this period, the general strong retreat of all glaciers caused the disappearance of the Northey and Darwin glaciers, as well as the loss of the southeastern part of Lewis Glacier, which split into two segments between 2014 and 2016. This recession results in an area extent of 0.024 km2 for the Lewis Glacier, implying a loss of 62% in five years. Lewis Glacier had been the greatest glacier on Mount Kenya, but now the Tyndall glacier is of similar size with an extent of 0.025 km2 (table S3). However, the mapping of the Tyndall glacier contains potentially large uncertainties regarding the lower glacier section that could be declared debris or debris-covered ice. All remaining glaciers on Mount Kenya are located on the western side of the mountain peaks. Their mass has retreated to topographically-shaded areas, demonstrating the importance of incoming solar radiation in governing glacier retreat (figure 4, Kruss and Hastenrath 1987, Mölg et al 2003b).

Figure 4. Glacier extents on Mount Kenya between 1947 and 2021/2022 (data from Hastenrath 2005, Prinz et al 2011, 2016, 2018. Extent of Lewis Glacier (LG) ∼ 1880: Prinz et al 2016; LG extents 1947–2004: Prinz et al 2011; Mt. Kenya 1947–2004, LG 1987: Hastenrath 2005; Mt. Kenya 2016: Prinz et al 2018).
Download figure:
Standard image High-resolution image3.3. Rwenzori Range
The Rwenzori Range is the only glacierized high mountain region in East Africa influenced by moister climatic conditions. While six mountains in the range were glaciated at the beginning of the 20th century, the number dropped to three mountains of the Central Rwenzori by the 1990s: Mount Stanley, Mount Speke, and Mount Baker (Kaser and Osmaston 2002). These mountains had a glacier area of 0.38 km2 in January 2022 (figure 5), with Mount Stanley accounting for 92% of the glacier area (see the supplementary figure S6, table S4 for details). Based on an estimated extent of 1.14 km2 in 2005 (Mölg et al 2006), there has been an overall retreat of 67% since.

Figure 5. Glacier extents in the Rwenzori Range between 1906 and 2022 (data from Kaser and Osmaston 2002).
Download figure:
Standard image High-resolution imageOn Mount Baker, only small fragments of the Edward and the Y glaciers remain, with a cumulative extent of only 8.2 × 10³ m2. The Y Glacier did not appear in the 1990 estimates of Kaser and Osmaston (2002), but in every considered satellite image. Therefore, it could be an ice remnant of the glacier or a multi-annual firn field, which cannot be verified without further field observations. Within the 30 year period, the glaciers on the southeastern slope of Mount Baker and large parts of the Edward Glacier have disappeared (figure 5). Mount Speke shows a similar and strong glacier loss since the 1990s, where 94% of the glacier area has disappeared. Although three glaciers remain, with an overall extent of 31.3 × 10³ m2, Speke Glacier accounts for most of the glacier area at 29.67 × 10³ m2. It is situated on the western slope of the mountain and has shrunk by 85% since 1993 (see Kaser and Osmaston 2002). The glaciers on Mount Stanley cover an area of 0.35 km2 and have receded from their 2005 extent by 57%. Additionally, ice cover on the Stanley Plateau, which had been continuous until 1990, has split up into a number of different glacier entities (Mölg et al 2006). It now consists of the main parts of two primary entities—the Stanley and Elena glaciers, with an extent of 0.14 km2, representing the most substantial part of Mount Stanley's glacierization.
3.4. Synopsis: glaciers of East Africa
The recession of the tropical glaciers in all three regions of East Africa has been distinctive. Compared to the first reliable glacier surface area observations around 1900, Kilimanjaro has only retained 8.6% of its glacier area, Mount Kenya 4.2% and the Rwenzori Range 5.8% (table 2).
Table 2. Glacier extents in km2 in East Africa since ∼1900. (1) Cullen et al (2013), (2) Prinz et al (2018), (3) Hastenrath (2005), (4) Kaser and Osmaston (2002), (5) Mölg et al (2006).
| Kilimanjaro1 | Mount Kenya2 | Rwenzori4 | ||||
|---|---|---|---|---|---|---|
| ∼ 1900 | 11.400 | (1912) | 1.640 | (1899) | 6.51 | (1906) |
| ∼ 1955 | 7.320 | (1962) | 0.874 | (1947) | 3.81 | (1955) |
| ∼ 1990 | 3.800 | (1993) | 0.413 | (1993)3 | 1.67 | (1990) |
| ∼ 2010 | 1.762 | (2011) | 0.154 | (2016) | 1.14 | (2005)5 |
| 2021/2022 | 0.979 | 0.069 | 0.377 |
While Prinz and Mölg (2020) concluded that more than 80% of the East African glacier area had disappeared by ∼2010, the new estimates for the early 2020s show that more than 90% of the modern glacier extents are gone (figure 6). Retreat rates do not show any systematic differences, although times of slower and more accelerated retreat occur (figure 6, Prinz and Mölg 2020).

Figure 6. Glacier area loss on Mount Kenya, in the Rwenzori Range and on Kilimanjaro. Left y-axis: Area in absolute values with different scales. Right y-axis: percentage relative to the first measured area estimates. Bold values describe the mean area retreat rate between the labeled and previous point in time (in 1000 m2 per year). Adapted from Prinz and Mölg (2020). CC BY 4.0.
Download figure:
Standard image High-resolution image
4. Discussion and conclusion
The tropical glaciers of East Africa have been retreating since at least the late 19th century, which is consistent with observations of retreat of glaciers elsewhere in the world. There is evidence that a shift in the regional moisture regime towards a drier climate in the late 19th century contributed to the observed onset of retreat in East Africa (Mölg et al 2009a, Prinz et al 2016). While recent research has focused on single glaciers on Kilimanjaro and Mount Kenya and the impact of atmospheric processes and climate dynamics (see section 1), there have been no current investigations of the three mountain regions as a whole and their present glaciation, including the Rwenzori Range. The present study, therefore, determined the most recent glacier extents on Kilimanjaro, Mount Kenya and in the Rwenzori Range from the analysis of high-resolution satellite images for the years 2021/2022. The remaining glacier surface area on Kilimanjaro is 0.98 km2, 0.069 km2 on Mount Kenya and 0.38 km2 in the Rwenzori Range. Hence, the new data show that glacier loss in East Africa continues unabated and continues to follow a nearly linear recession pattern over time.
On Kilimanjaro, the differentiation between the glacier regimes is based on dominant physiogeographic factors (aspect, slope, elevation, shape) and the resultant variation in incoming solar radiation. The latter's influence is, furthermore, regulated by cloudiness and the albedo of the glaciers and their surrounding surfaces (e.g. Mölg and Hardy 2004). Since the cloudiness is, apart from the hygric seasonality, linked to the diurnal cycle of local convection and insolation, the retreat pattern is typically stronger in the eastern and southern sections of the glaciers than on the western sides (e.g. the glaciers of the former SIF—see figure 3; Mölg et al 2009b, Nicholson et al 2013). Another phenomenon governed by the insolation is the formation of the notches at the outer ice margins. The lower albedo of the darker surroundings leads to longwave heating (Winkler et al 2010), which most likely influences the formation of the East–West orientated notches on the plateau's ice fields and the radial notches on the slope glaciers. The East–West orientation is also dominant for the plateau's ice fields themselves and is an effect of solar radiation geometry (Mölg et al 2003a, Winkler et al 2010).
An additional factor impacting the areal retreat on the plateau could be the reduction in ice thickness (e.g. Bohleber et al 2017, Stadelmann et al 2020). Despite a limited contribution throughout the 20th century compared to other retreat mechanisms, the influence has increased in the most recent decades and, for example, has led to an asymmetric decline of the Furtwängler Glacier, characterized by the retreat of its northwestern sector since 2011 (see also NIF; figure 3).
Similar to some glaciers on Kilimanjaro, the south-facing glaciers of Mount Kenya are affected by high amounts of solar radiation, whereas the westward slopes are often 'protected' by clouds formed through the diurnal cycle of convection (Troll and Wien 1949). Furthermore, the impact of a decrease in albedo by sediments washed onto the glacier from debris surroundings and the nearby bedrock leads to longwave heating affecting the adjacent ice (Prinz et al 2018).
In contrast to Kilimanjaro, the glaciers of Mount Kenya and the Rwenzori Range are situated at lower elevations. During the daytime, a stronger sensible heat flux to the surface occurs and the glacier surface air temperatures are more often close to 0 °C when the incoming radiation is highest at noon, which can lead to melting (Nicholson et al 2013). With the disappearance of the lower part of the Lewis Glacier and the Darwin Glacier at elevations around 4700 m on Mount Kenya, this influence of melting seems likely. However, the Tyndall and Heim glaciers still exist at similar elevations. In comparison to the 2016 extent, the Krapf Glacier has an exceptional retreat pattern, with the main loss of glacier ice occurring at its higher elevations (figure 4). From the analysis of the satellite images, it is apparent that the Krapf Glacier has receded into the shade area of its eastward ridge, pointing to solar radiation as the predominant factor, which is consistent with an earlier study of the glaciers on Mount Kenya (Kruss and Hastenrath 1987). Similar processes appear at work in the Rwenzori Range, where the glaciers of all three mountains retreated further to the shade-favored areas of their mountain ridges. This indicates the importance of incoming solar radiation and the diurnal convection cycle for favoring glacier preservation in the western sections (figure 4, Mölg et al 2003b). All Rwenzori glaciers have also receded to higher elevations, as it was mentioned before for Mount Kenya.
The manual analysis of the satellite images enables a direct evaluation of the glacier outlines. The accessibility of daily Planet Labs imagery opens up the possibility of multitemporal investigations in regions of high convective cloudiness and fast-changing snow cover conditions. However, difficulties within the images concerning snow cover, cloudiness and shadowing do exist, complicating glacier delineation. To account for uncertainties in the estimations, we considered three different possibilities of extent interpretation (see section 2 and supplement for details). This assessment shows that the glacier surface area in each of the three regions lies within ±12.5% uncertainty which is in the expected uncertainty of 1%–15% as stated by Paul et al (2013). Accordingly, the total glacier surface area in East Africa in 2021/22 lies between 1.2 and 1.54 km2.
The estimation of the recent glacier extents sheds light on the current retreat rate and pattern, but does not resolve the underlying processes. However, much process-based research has been conducted for Kilimanjaro's and Mount Kenya's glaciers (see section 1), which revealed the importance of snowfall as a local climatic driver—a variable that is ultimately tied to conditions in the Indian Ocean and, hence, affected by our warming planet (Mölg et al 2009a, Mölg and Pickler 2022). What both process-based and glacier-extent studies demonstrate consistently is that East African glaciers are in a mode of strong mass loss; as noted by Cullen et al (2006) in reference to Kilimanjaro, they are only remnants of a former glaciation and will largely disappear by mid-century if the local climatic conditions on the mountain summit persist, which is supported by conceptual (Kaser et al 2010) and quantitative (Mölg et al 2003a) physically-based models.
Acknowledgments
We thank Martin Perfler and John Wendle for providing recent photos of Mount Kenya and Mount Stanley in the Rwenzori Range. We would also like to thank Planet Labs for the education and research access to the PlanetScope satellite imagery. This research was supported by the German Science Foundation DFG (Grants MO 2869/3-1 and MO 2869/3-2)
Data availability statement
The data that support the findings of this study are openly available at the following URL/DOI: https://doi.pangaea.de/10.1594/PANGAEA.963210.
Supplementary data (0.7 MB PDF)