Where does Arctic beach debris come from? Analyzing debris composition and provenance on Svalbard aided by citizen scientists
 Anna Natalie Meyer
 Birgit Lutz2
  Melanie Bergmann
- 1Alfred Wegner Institute Helmholz Centre for Polar and Marine Research, Bremerhaven, Germany
- 2MS Cape Race c/o Alfred Wegner Institute Helmholz Centre for Polar and Marine Research, Bremerhaven, Germany
Plastic debris is ubiquitous in all ecosystems and has even reached locations that humans will hardly reach such as the deep ocean floor and the atmosphere. Research has highlighted that plastic debris is now pervasive even in remote Arctic regions. While modeling projections indicated local sources and long-distance transport as causes, empirical data about its origin and sources are scarce. Data collected by citizen scientists can increase the scale of observations, especially in such remote regions. Here, we report abundance and composition data of marine debris collected by citizen scientists on 14 remote Arctic beaches on the Spitsbergen archipelago. In addition, citizen scientists collected three large, industrial sized canvas bags (hereafter: big packs), filled with beached debris, of which composition, sources and origin were determined. A total debris mass of 1,620 kg was collected on about 38,000 m2 (total mean = 41.83 g m-2, SEM = ± 31.62). In terms of abundance, 23,000 pieces of debris were collected on 25,500 m2 (total mean = 0.37 items of debris m-2, SEM = ± 0.17). Although most items were plastic in both abundance and mass, fisheries waste, such as nets, rope, and large containers, dominated in mass (87%), and general plastics, such as packaging and plastic articles, dominated in abundance (80%). Fisheries-related debris points to local sea-based sources from vessels operating in the Arctic and nearby. General plastics could point to both land- and ship based sources, as household items are also used on ships and debris can be transported to the north via the oceans current. Overall, 1% of the items (206 out of 14,707 pieces) collected in two big packs (2017 and 2021), bore imprints or labels allowing an analysis of their origin. If the categories ‘global’ and ‘English language’ were excluded, most of identifiable items originated from Arctic states (65%), especially from Russia (32%) and Norway (16%). But almost a third of the items (30%) was of European provenance, especially from Germany (8%). Five percent originated from more distant sources (e.g. USA, China, Korea, Brazil). Global measures such as an efficient and legally binding plastic treaty with improved upstream measures and waste management are urgently needed, to lower the amount of plastic entering our environments and in turn lifting the pressure on the Arctic region and its sensitive biota.
1. Introduction
Recent research has highlighted that novel entities including plastic pollution already exceed the planetary boundary (Persson et al., 2022), as production and releases are increasing at a pace that surpasses the global capacity for assessment, monitoring and mitigation. This corresponds with the consensus that plastic debris has become ubiquitous in marine ecosystems including remote uninhabited Arctic beaches (Bergmann et al., 2017b). The Arctic is no longer seen as “one of the last unspoiled wildernesses” on Earth, but as an ecosystem that likely constitutes a sink for marine anthropogenic debris with increasing pollution levels over time (van Sebille et al., 2012; Parga Martínez et al., 2020; Bergmann et al., 2022b). This will be exacerbated by the growing global plastic production, which is projected to double by 2045 and reach 1.1 billion metric tons (Geyer, 2020), 11% of which enter aquatic environments (Borrelle et al., 2020). Furthermore, the formation of a sixth accumulation area has been predicted for the Nordic Seas (van Sebille et al., 2012; Onink et al., 2019). And with temperatures rising at a fourfold higher rate than the global average (Rantanen et al., 2022), the sea ice extent decreases giving plastic debris the chance to penetrate yet deeper into the Arctic Ocean (Bergmann and Klages, 2012). This exacerbates the pressure on sensitive Arctic biota, such as polar bears, reindeer, seals, and seabirds (Bergmann et al., 2017a). The consequences could be serious, as wildlife becomes entangled in nets or rope or ingests plastic debris (Bergmann et al., 2017b; Collard and Ask, 2021; Bergmann et al., 2022b). This is also observed on the Svalbard archipelagos, where most recorded waste was related to the fisheries (Bergmann et al., 2017a; Nashoug, 2017).
Although research has recently highlighted the presence of plastic debris in some compartments of the Fram Strait such as the sea surface, water column and the deep seafloor (Bergmann et al., 2016; Tekman et al., 2017; Grøsvik et al., 2018; Parga Martínez et al., 2020; Tekman et al., 2022a), such observations rarely allow identification of the provenance of debris. Modeling patterns indicate that a large part of debris drifts northwards with the Atlantic or originates from local sources (Pogojeva et al., 2021; Strand et al., 2021), however, empirical evidence is still limited. Beaches on remote uninhabited islands intercept prevailing water currents and the debris they carry (Lavers and Bond, 2017), therefore the collection of physical samples for analyzing the origin of the debris could be a good approach, especially as macroplastic on beaches was estimated to constitute 23% of the global ocean plastics (Isobe and Iwasaki, 2022). Similarly, a global meta-analysis of anthropogenic debris at the sea surface, on beaches and on the seafloor indicated highest quantities on beaches (Haarr et al., 2022).
Citizen science studies increasingly complement academic research as they expand the spatial and temporal scale of observations (Nelms et al., 2017; Walther et al., 2018), especially with regard to understudied remote ecosystems (Bergmann et al., 2017a) on a local, regional and international scale (Hidalgo-Ruz and Thiel, 2015). During the Covid-19 pandemic, where travel was limited and a surge of production, consumption and disposal of single use plastics occurred, the importance of citizen science became even more apparent, as travel restrictions hindered scientists from visiting specific survey sights and citizen scientists were able to retrieve samples since they were on site already (Ammendolia and Walker, 2022). Engaging citizens in science can also increase science and ocean literacy and thereby establish trust and motivate behavior changes (Nelms et al., 2017; Locritani et al., 2019).
Here, we present debris data from 14 Arctic beaches, and from three large, industrial-sized canvas bags (hereafter: big packs), filled with Arctic beach debris collected by citizen scientists on Svalbard. We quantified the debris mass and abundance per m2 to determine current pollution levels and composition of Arctic beaches. These data were compared with those from the seafloor (Parga Martínez et al., 2020) and sea surface (Tekman et al., 2022a) in the region to delineate potential sinks of marine debris. The provenance of debris was determined to assess if items come from local or distant sources. Furthermore, debris items were inspected for date information to assess their age and the approximate time of pollution. In addition, we analyzed if items can be assigned to a certain sector, and in connection with that, what the debris entry points into the ocean could be: land-based or sea-based sources. Such knowledge is important to tailor solutions to reduce Arctic plastic pollution, and as baselines for future monitoring of the efficiency of upstream interventions such as a UN Plastics Treaty (Stokstad, 2022).
2. Material and Methods
All beach surveys were carried out by citizen scientists during tourist cruises between 2016 and 2021, which were organized and led by a tour guide and supported by the ship crew. This collaboration was sought by an experienced tour guide (Birgit Lutz) who already conducted cleanups during shore excursions and wished to support science after reading media reports on marine debris floating in Arctic waters prompted by the publication of Bergmann et al., 2016. A protocol for surveys was co-developed via video conferences to be feasible for visitor groups on Arctic beaches.
2.1. Study area
The sampling locations were located on the Spitzbergen archipelago in the eastern Arctic, which is influenced by several current systems that can be separated into warm- and cold-water currents (Figure 1). The West Spitsbergen Current (WSC) transports warmer waters from the Atlantic Ocean towards the north along the west side of Svalbard (Greenland Sea) (Przybylak et al., 2012). Cold waters are transported by the East Spitsbergen Current (ESC), which flows from the Arctic Ocean through the Nansen Basin past the east and along the southern part of Svalbard (Barents Sea), until it transports the water masses along the west (Greenland Sea) back towards the north pole (Wassmann et al., 2019). Another influence in this region are fisheries, especially in the Greenland Sea, off Svalbard and the Barents Sea (Garcia, 2007). The three main target species caught by Norwegian vessels in the Svalbard Fishery Protection Zone (1980 – 2013) include capelin (Mallotus villosus), cod (Gadus morhua) and shrimp (Pandalus borealis) (Misund et al., 2016).
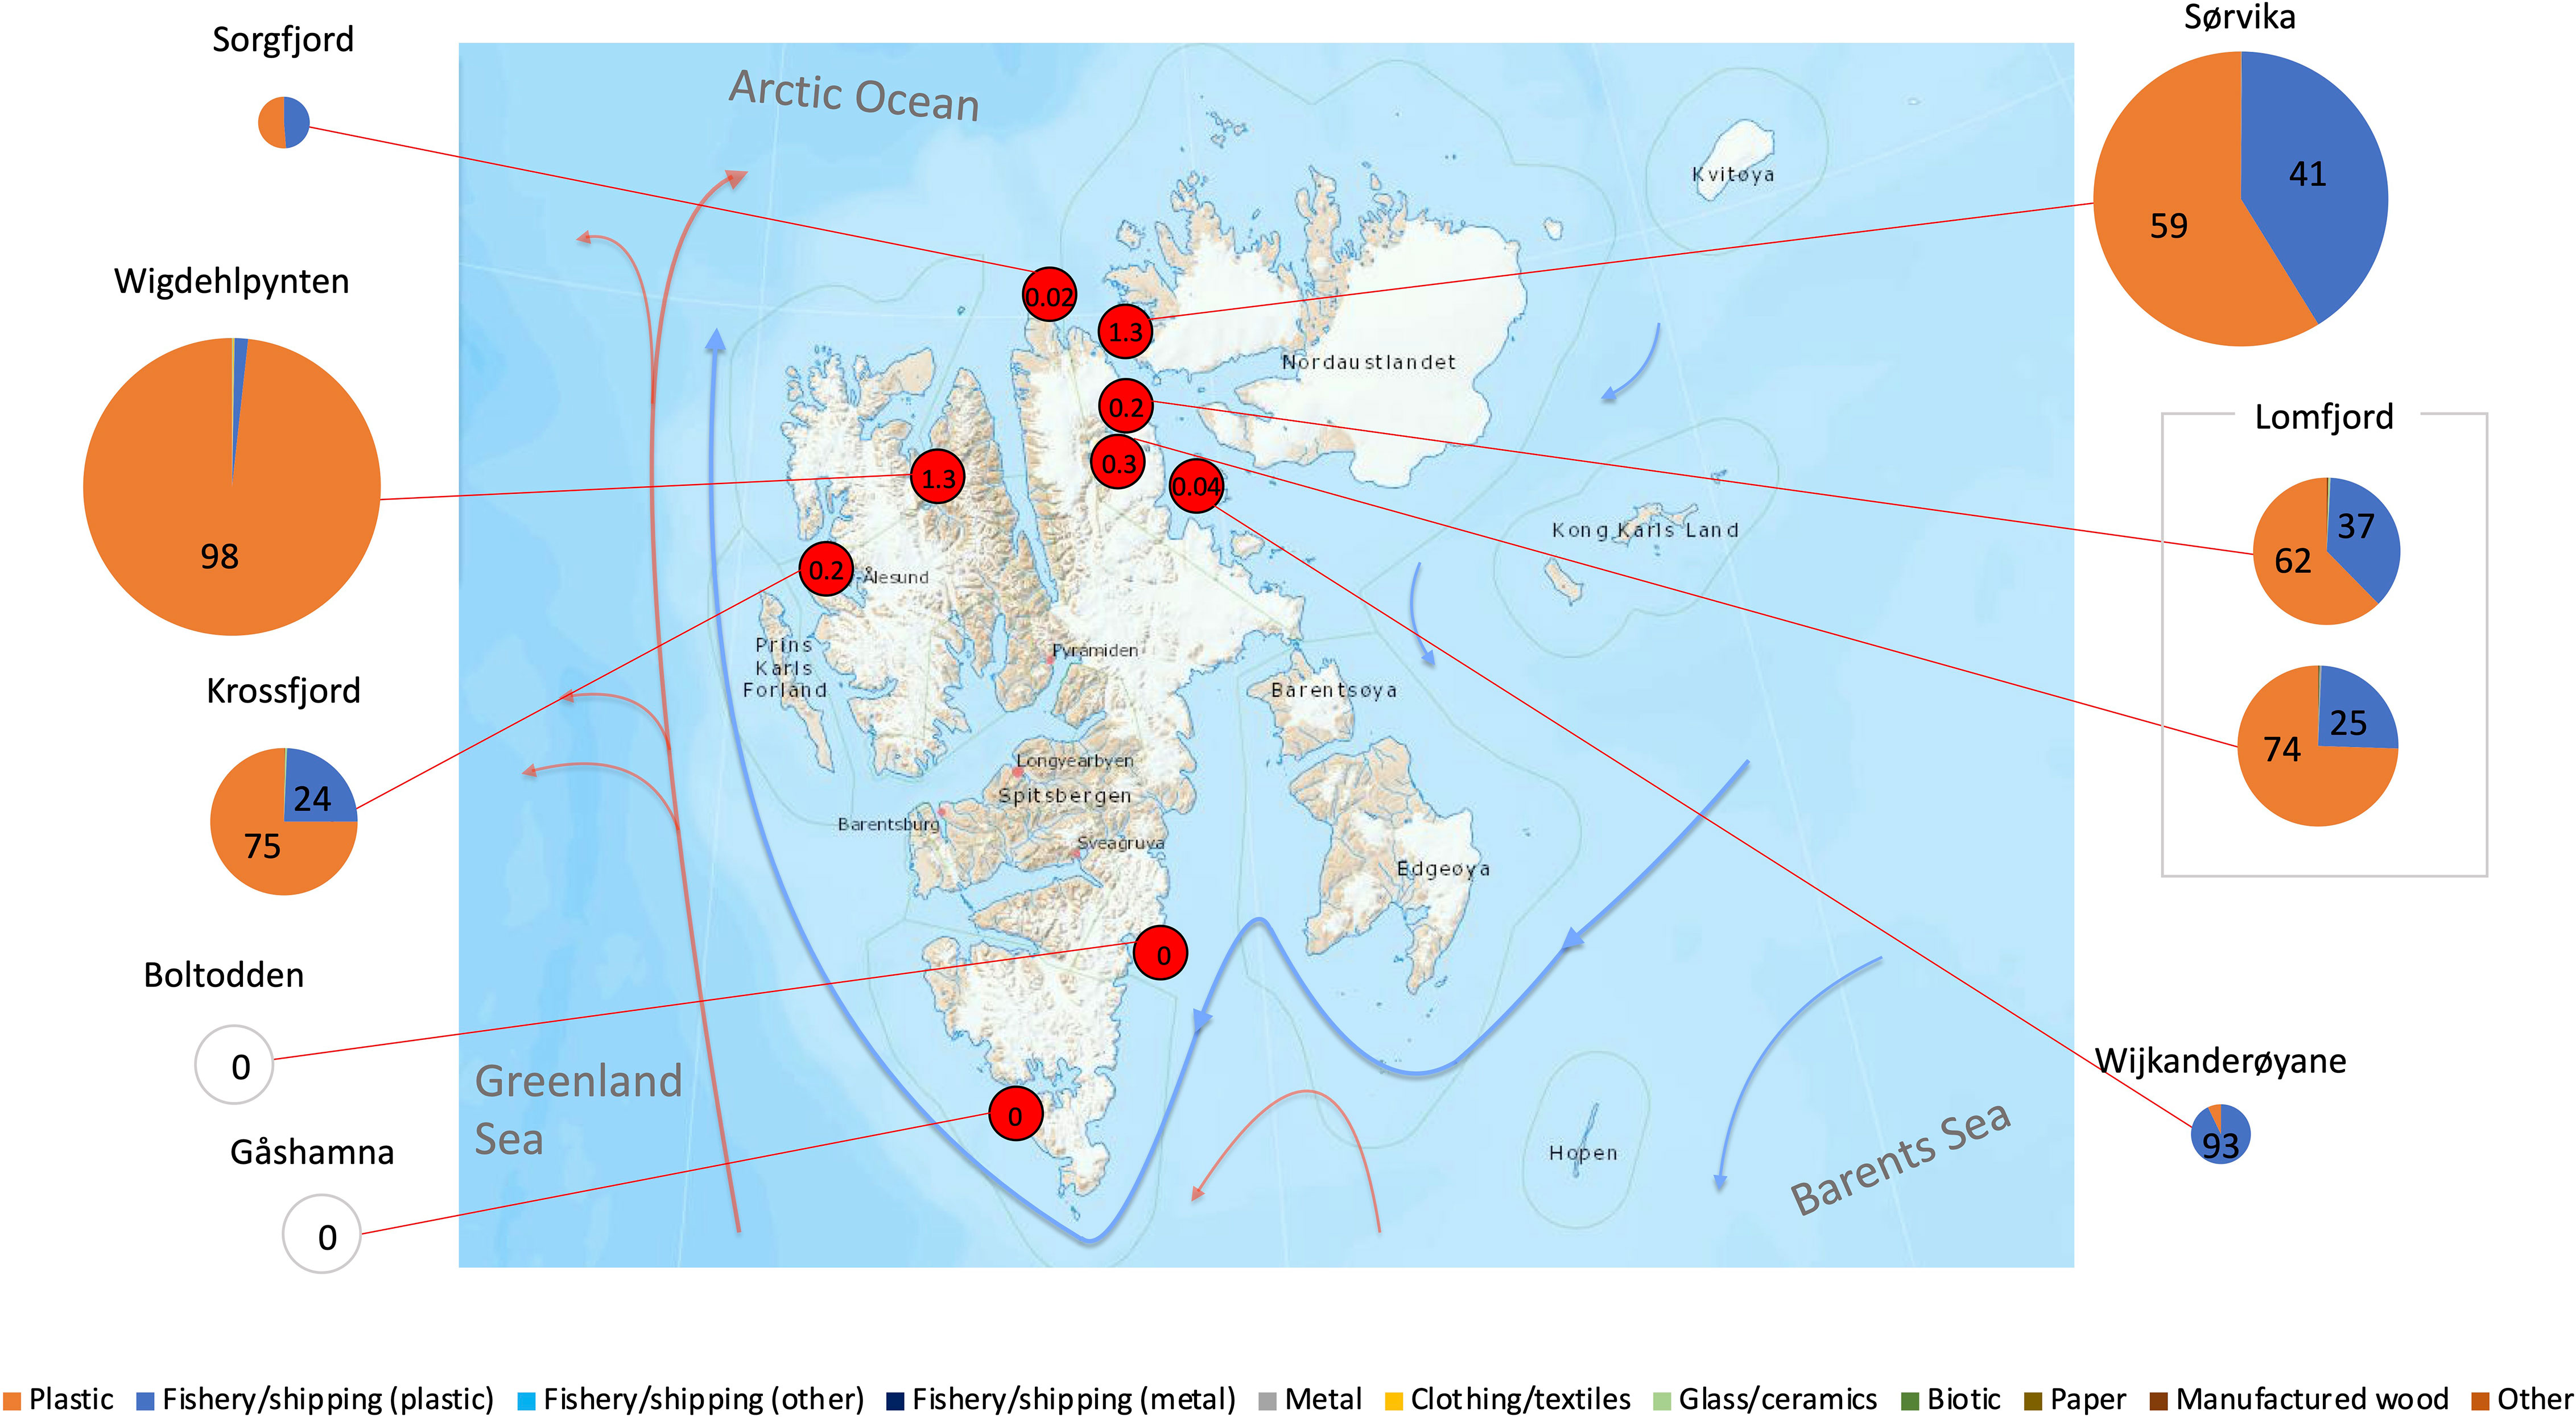
Figure 1 Map of all locations of beach debris surveys (abundance) depicted by red dots with number of items collected m-2, which is also scaled by the relative size of pie charts showing the rounded proportions [%] of debris categories. Log (x+1)-transformed abundances were used to improve the graphic representation. Arrows depicting the warm West Spitsbergen Current (red) and cold East Spitsbergen Current (blue) were placed according to Svendsen et al. (2002) (Map © Norwegian Polar Institute).
The selection of survey locations depended on cruise schedule, weather, and sea conditions. Two numerical factors were recorded: area size and observer number.
2.2. Survey and sampling design
All citizen scientists were adults. Their number varied between 1 to 38 observers depending on the group size of the cruise (Tables 1–4). Overall, the citizen scientists did not have detailed prior knowledge but were given a presentation on Arctic plastic pollution beforehand, which also explained the procedure and protocol of the surveys (see 2.3.1) and use of the equipment provided (hand-held Global Positioning System device (Garmin eTrex 30 x), measuring band, spring balances (KERN 285-052: ≤ 5 kg and 285-502; ≤ 50 kg; ± 0.3% accuracy)). All transects were laid out before taking samples and were of different sizes depending on the shoreline and terrain on site and ranged from 500 to ca. 5,500 m2. Using the GPS device, the geographic position of the corners of the transects, as well as their length and width were determined. The citizen scientists combed through this area for up to three hours and collected and sorted all anthropogenic items larger than 0.2 cm into different categories. Their weight and abundance were recorded along with beach properties and other metadata. Photographs were taken for a plausibility check and polar bear watches were held during all surveys. Participants were informed about the results via social media.
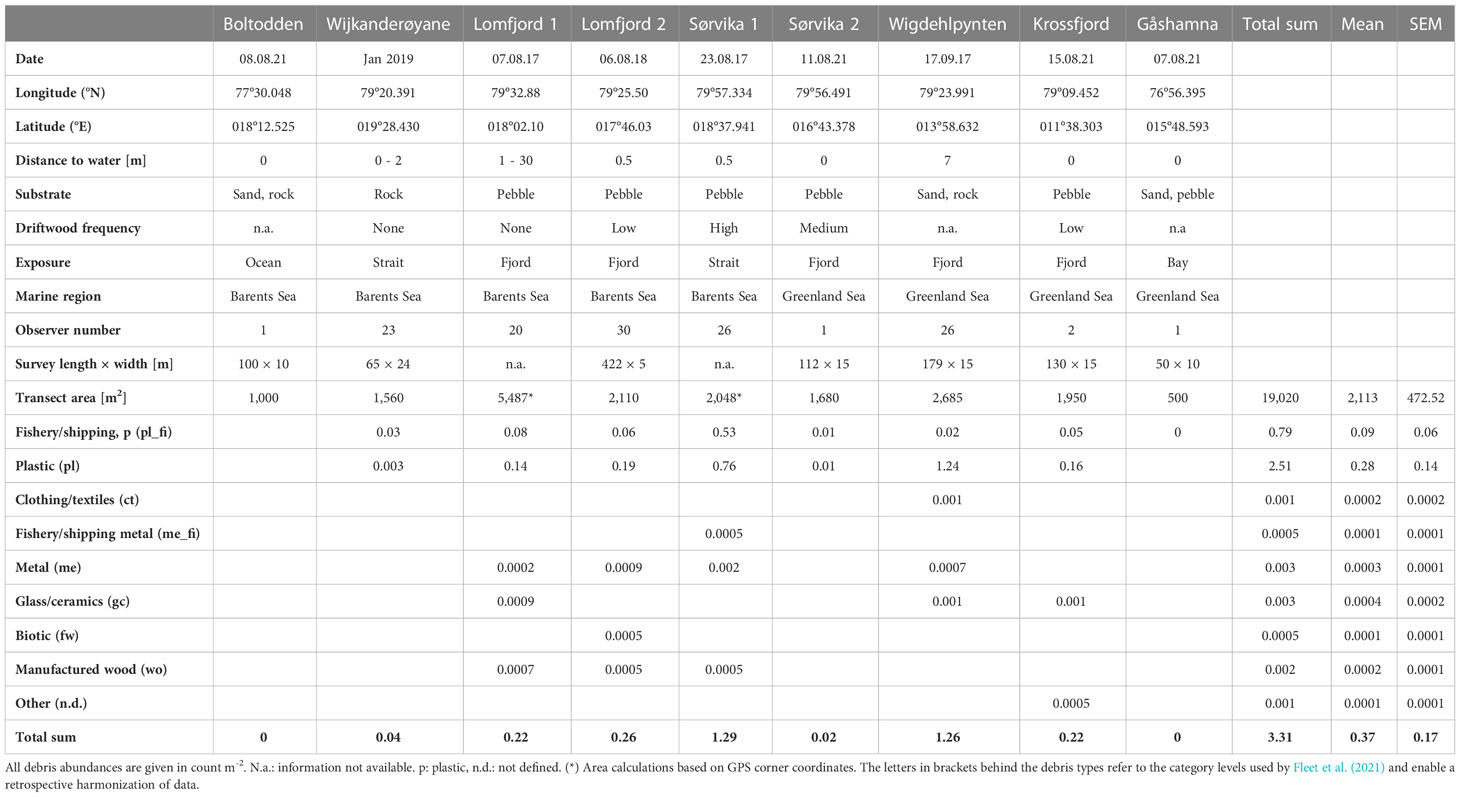
Table 1 Details of beach surveys undertaken by citizen scientists on Svalbard.
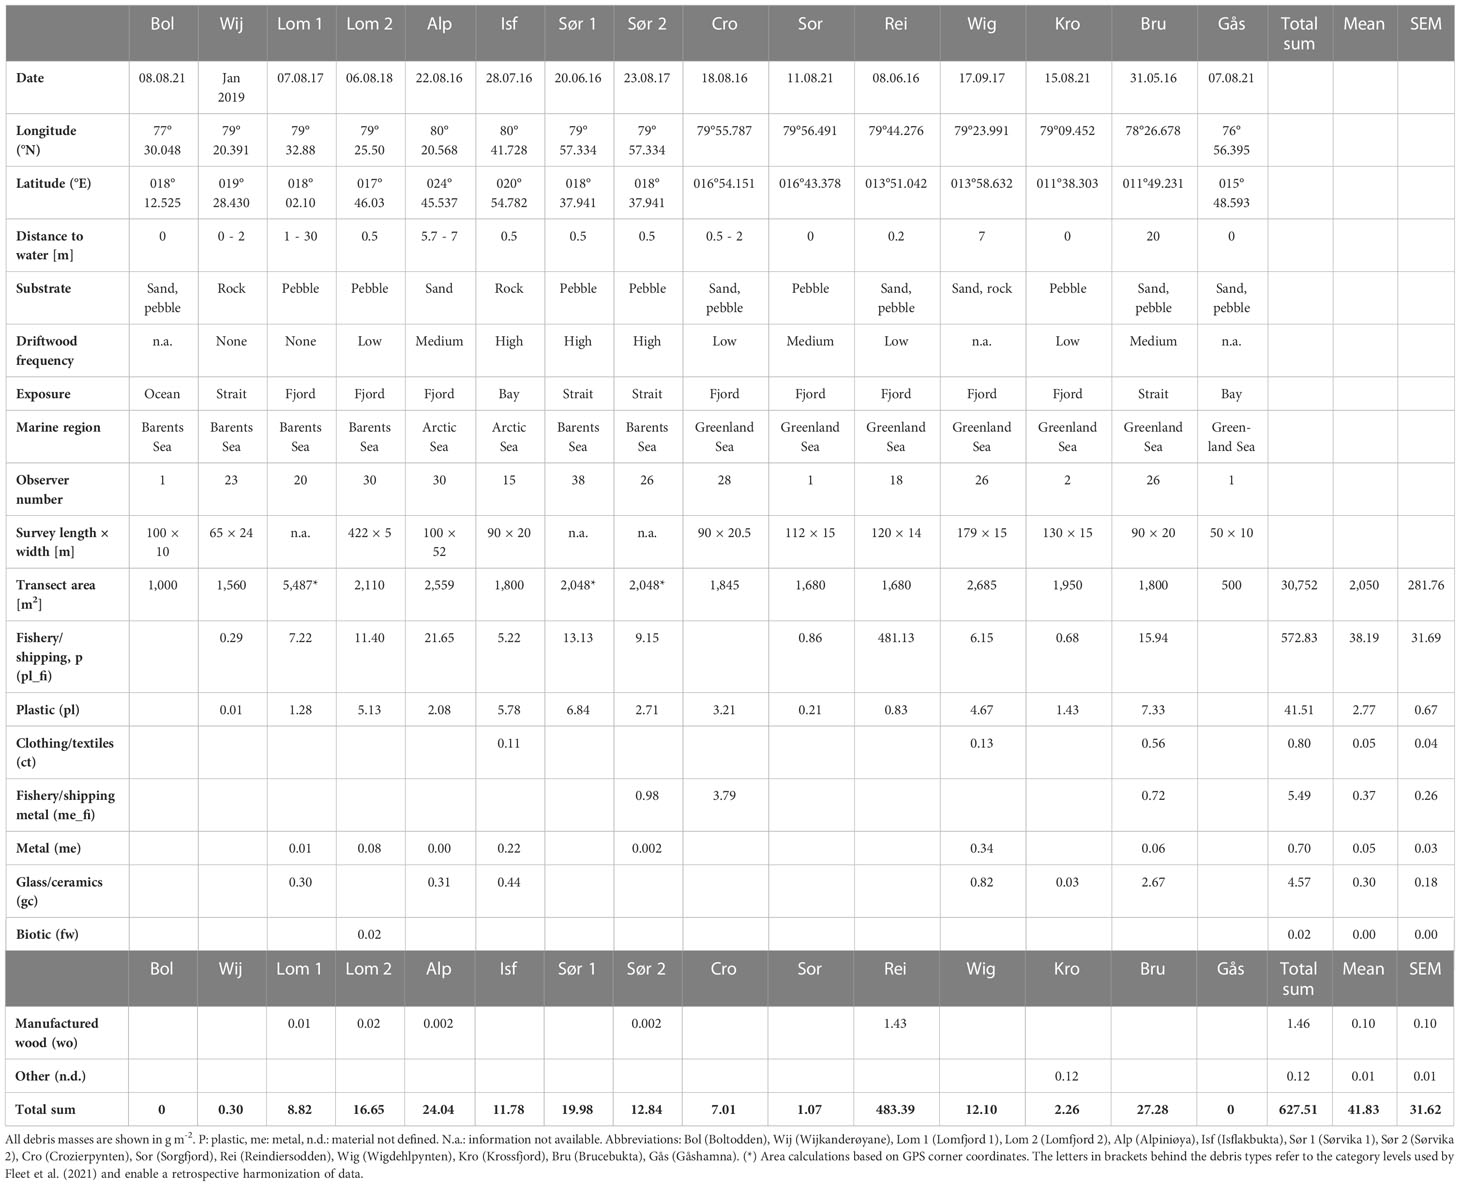
Table 2 Details of beach surveys undertaken by citizen scientists on Svalbard.
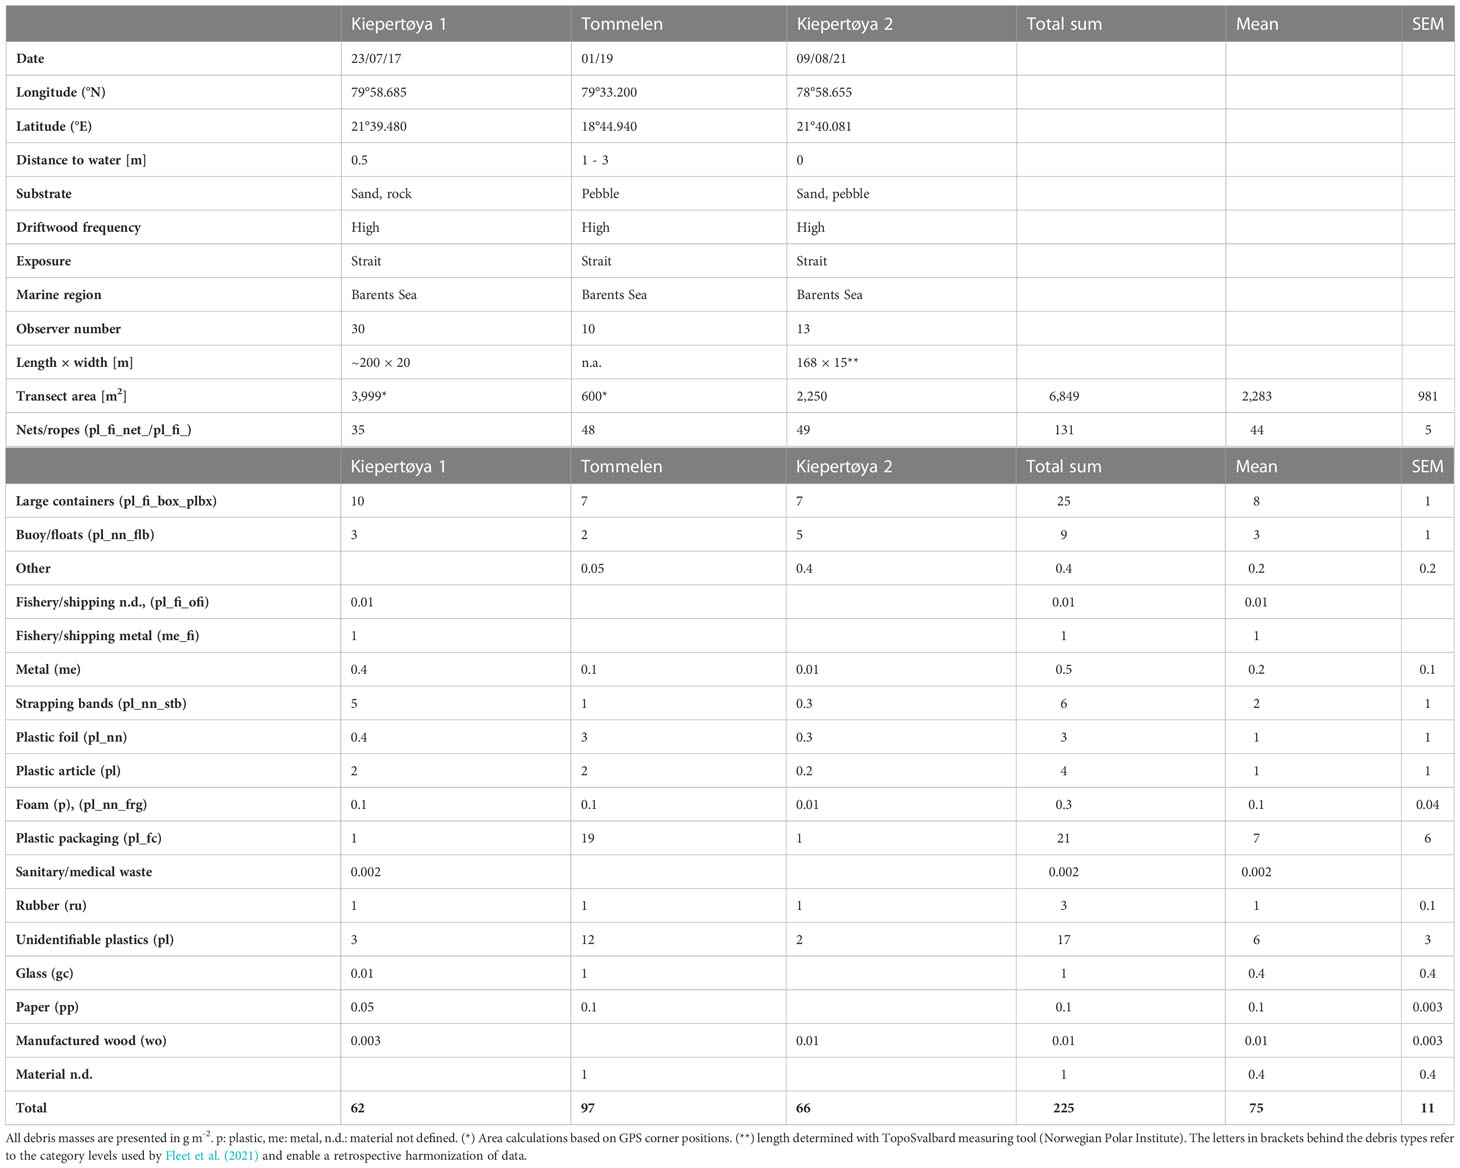
Table 3 Summary of results of high-resolution analyses of beach debris in big packs.
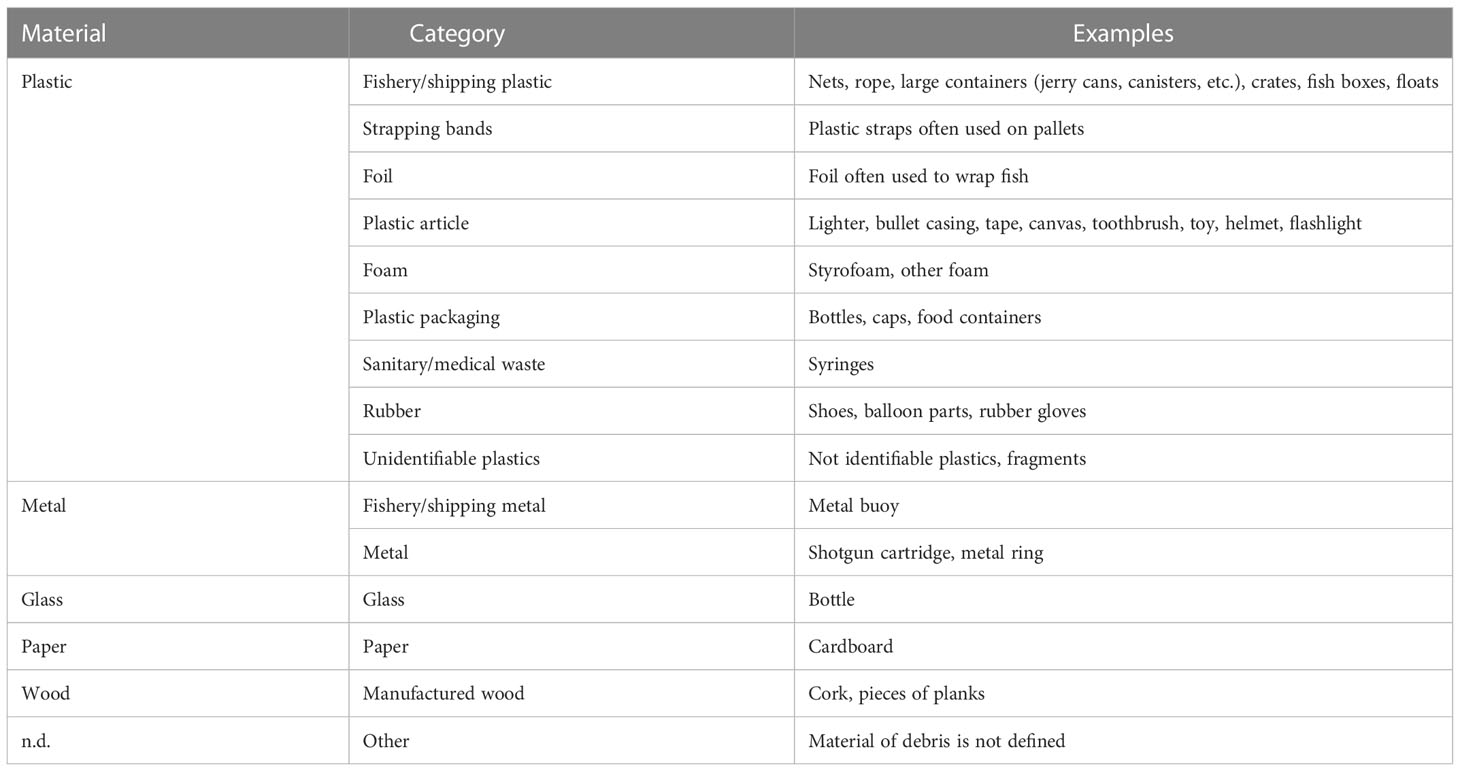
Table 4 Material and categorization of big pack debris, including examples (n.d. = not defined).
2.2.1. Sampling for provenance
In three of the transects, located in Hinlopen Strait, the collected debris was sent to AWI, for a more detailed analysis (Table 3). The first big pack (dimensions: 1.34 × 1.20 × 0.90 m; 1,443 m3) was collected on a north-facing beach on Kiepertøya (Beach 2) in 2017, an island located in the south of the Hinlopen Strait. The transect area was calculated after sampling, as it was located around a bay. The second one was filled on Tommelen (Beach 5), an island, which is part of the small archipelago of Tommeløyane, further north in the Hinlopen Strait. The sack was collected from an area of 600 m2. Here, the sides of the rectangle measured a = 20 m, b = 30 m, c = 28 m, and d = 8 m. The area was calculated using the “Theorem of Pythagoras”. Debris for the third big pack was once more collected on Kiepertøya (Beach 3). However, this was a different beach, also facing north. The measuring tool from TopoSvalbard (Norwegian Polar Institute) helped calculate a length of 163 m between the coordinates. The width was determined on site with 15 m from the shoreline (= 2520 m2). In the cases where the citizen scientists sampled for provenance, only pieces that did not fit in the big packs, where then documented on the survey forms and/or photographed.
2.3. Categorizing debris
2.3.1. Beach monitoring forms
The survey sheets, which were filled out by citizen scientists while on site and collecting debris, listed various debris types, such as fisheries-related debris (nets, ropes, floats) and other plastics, paper, glass/ceramics, biotic waste, etc. They were co-developed with the expedition leader, aiming for a simple, quick, and feasible design amenable to citizen science under cold Arctic conditions. Improvements, such as a slightly more distinguished categorization of debris have been made over time. In addition, the abundance of debris was recorded using a tally chart (since 2017). The survey sheets, including the information on weight, abundances and debris types were kept by Birgit Lutz (co-Author and expedition leader) and then forwarded to MB and ANM. To enable a retrospective harmonization of data, we added the code of Fleet et al. (2021) to our debris typology, which we had devised already in 2016 (Tables 1–3).
2.3.2. Big packs
In the absence of harsh Arctic conditions, the big packs could be analyzed in more detail at AWI. Each pack was inspected by different people, though all were executed or supervised by Melanie Bergmann. Anna Natalie Meyer inspected the debris collected in 2021, forming the basis for the categorization of different types (Table 4), as well as going over some of the debris items collected in 2019. During the categorization process of all three big packs all items bearing markings, writing or imprints were put aside to determine their provenance.
All debris that could be, without a doubt, identified as items from the fishing/shipping industry, were categorized as such. Examples include rope and nets, fish boxes, baskets and crates. They were not categorized as other plastics, as vessels operating in waters near Svalbard are possible sources for marine debris found on the surveyed beaches. Less well-constrained items such as strapping bands and plastic foil were listed separately.
2.4. Determination of provenance and age
All items in the three big packs bearing marks, writing, labels, or imprints, where scrutinized to determine their age or country of origin (hereafter: provenance), which refers to the country that an item was likely produced in. Note, that this is currently the only way to narrow down its origin, but it does not necessarily reflect that this is where debris entered the ocean or environment. So, while these data indicate how far debris can potentially be transported, they have to be interpreted with care.
All items collected from Kiepertøya in 2021 with marks were weighed, photographed and the information transcribed and translated. If necessary, a magnifying glass or binocular was used for a closer examination of items collected in 2019 and 2021. In some cases, “Google Lens” was used, which can translate and find pictures of similar-looking or identical items online and more by hovering the camera over an item. This served as an overview for items or even helped define what a piece was or what it had been used for. The provenance of items was determined based on the following criteria: (1) geographic information; (2) language (if multiple languages were shown, the language listed first was used); (3) company information (in some cases, inquiries were made regarding production country and date etc.) and (4) barcode. Items that are distributed at a global scale (e.g., Tetra Pak, Nestlé, Coca Cola) were classed as “Global”. The category “English language” was used for items with English writing, which cannot be assigned to the UK or US unambiguously. Figure 2 shows examples of items, classification and methods. Once the country of origin was determined, the debris was categorized according to Table 4. Year or date information was recorded.
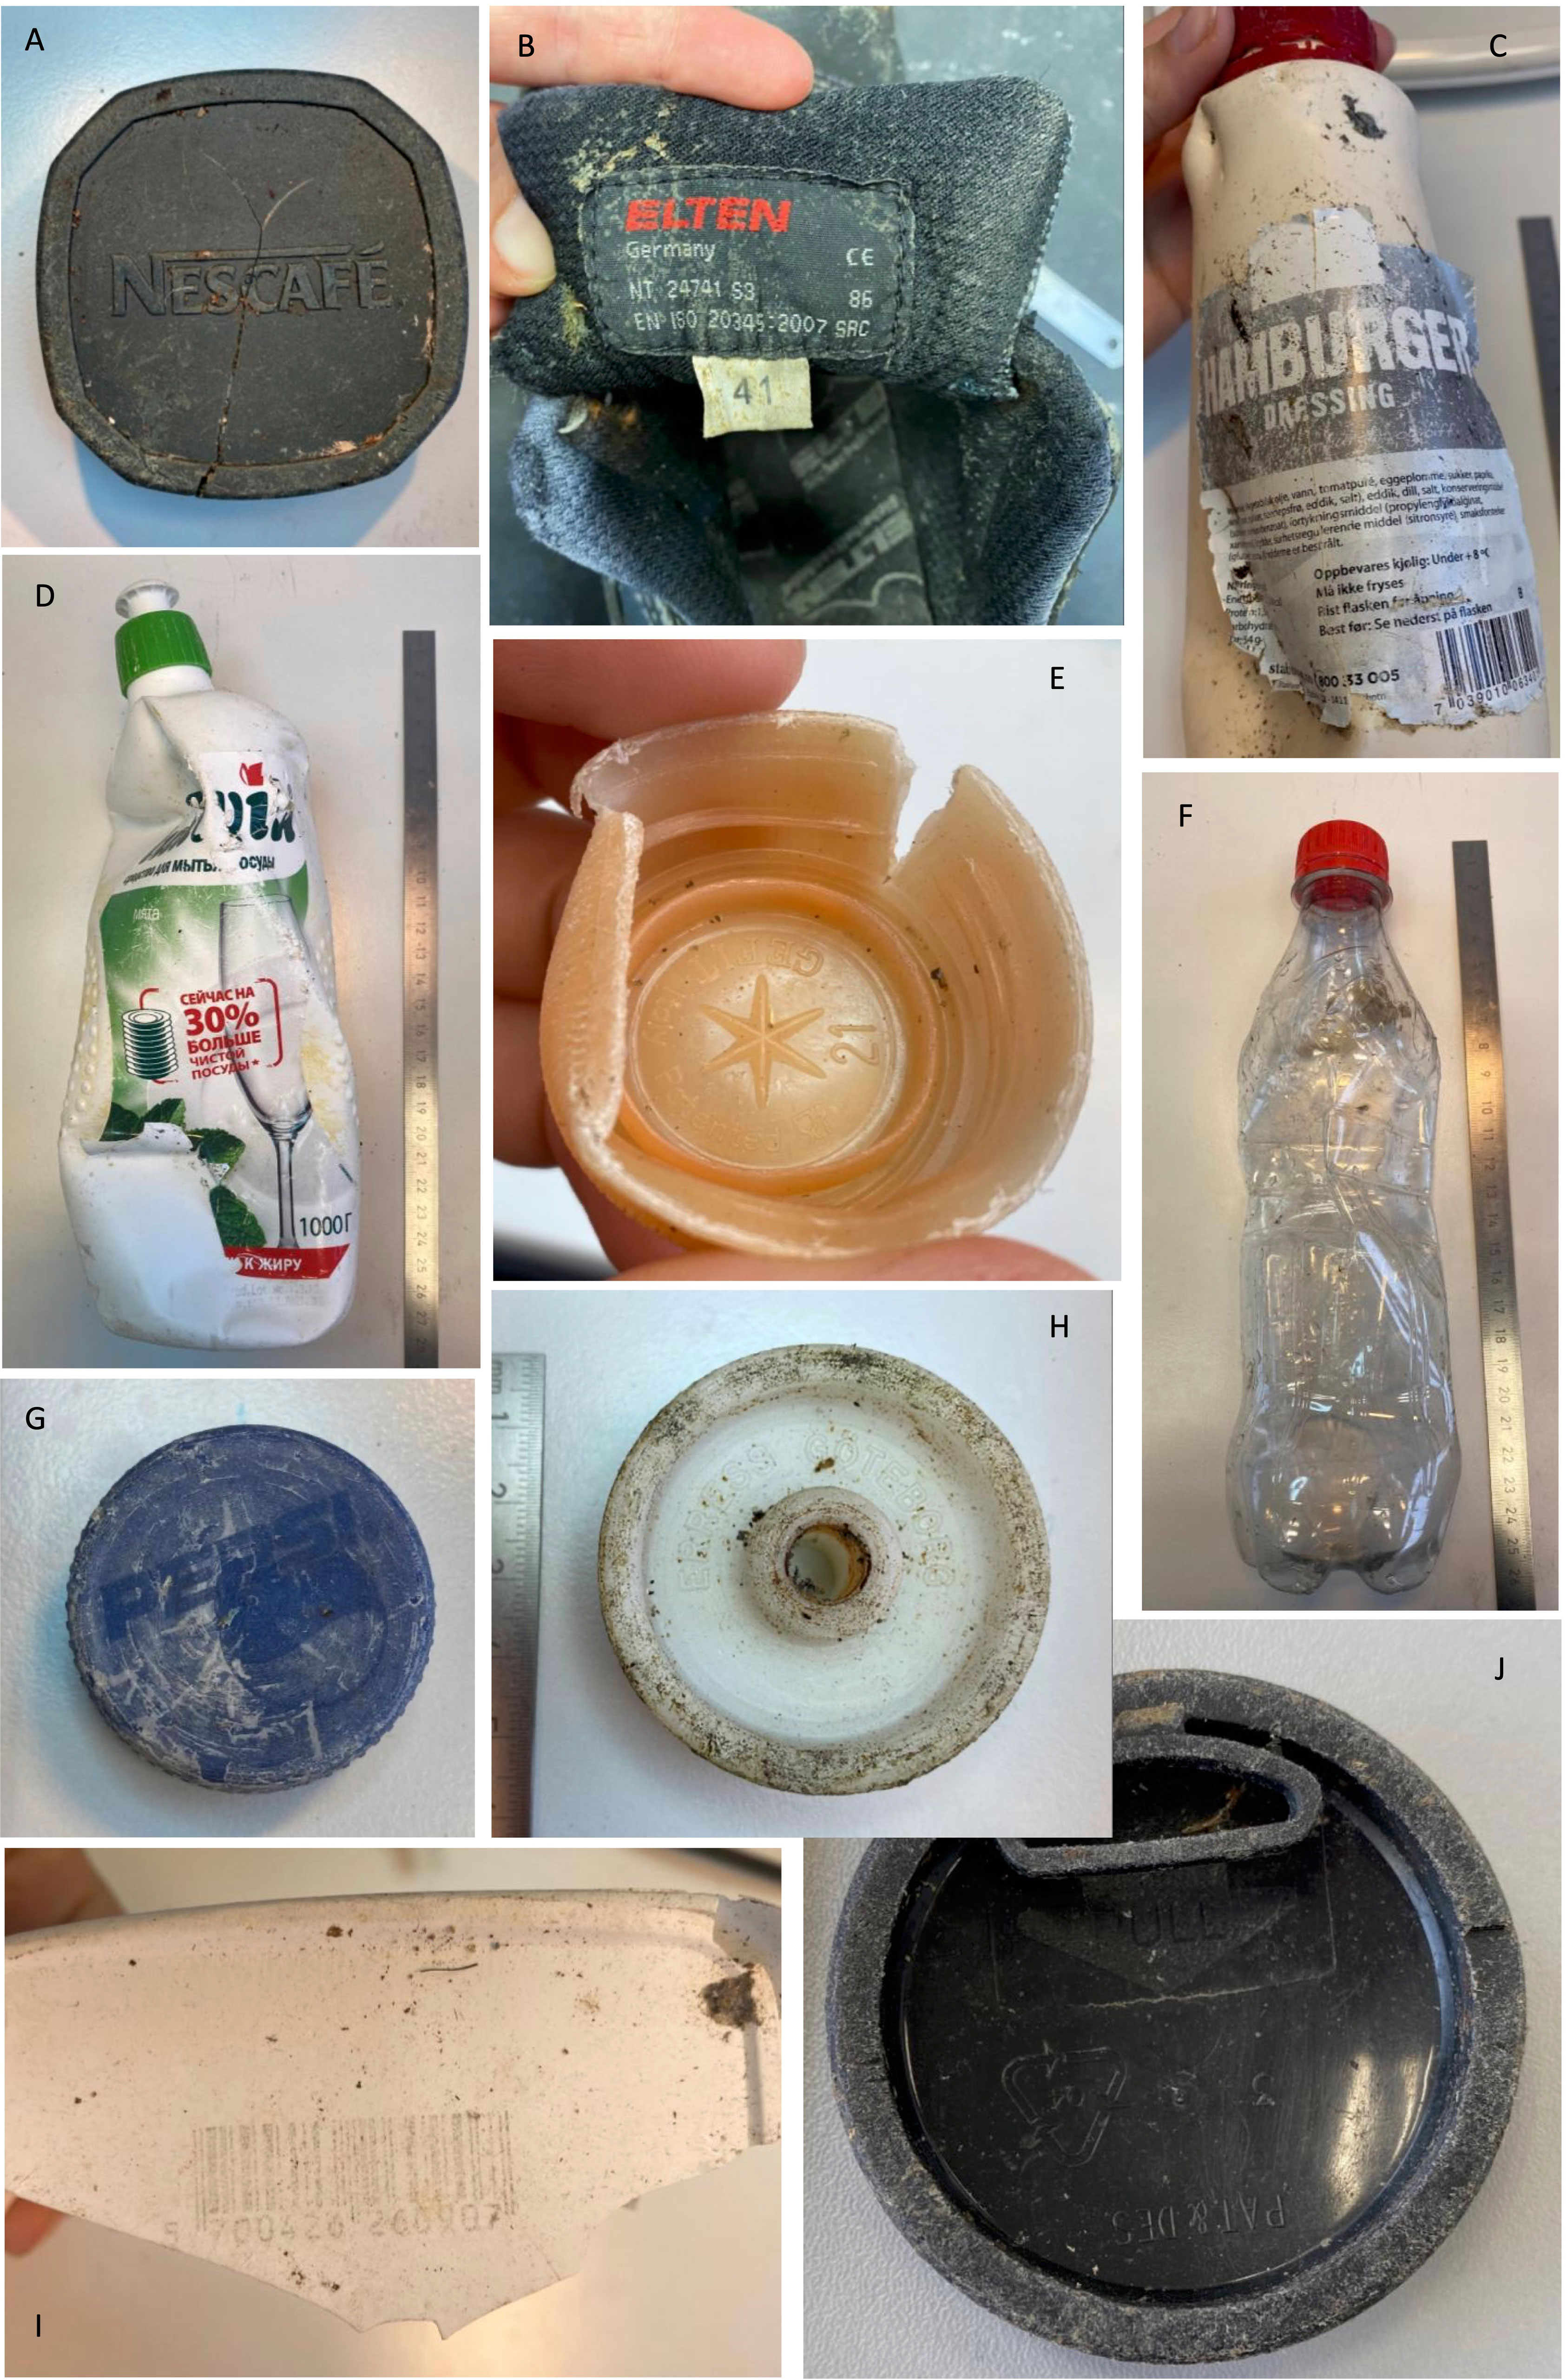
Figure 2 Photographs of items for which the provenance was determined, thus (A) Global, (B) Germany, (C) Norway, (D) Russia, (E) Italy, (F) Global, (H) Sweden, (I) Denmark, (J) English language.
2.5. Fourier transform infrared spectroscopy (FTIR)
The polymer type of all items collected in 2019 and 2021, for which the provenance could be determined and for which a physical item was still available, was determined by attenuated total reflection Fourier transform infrared spectroscopy (ATR-FTIR; ALPHA II model by Bruker Optics). In addition, a small subsample of ropes and strapping bands was analyzed to confirm their polymer identity. Here, 12.5% of all ropes (82 ropes out of 657 in total) and 1% of all strapping bands (20 out of 1819) were randomly selected. Using the software OPUS, the spectra were compared to polymers in the database and a hit quality above 700 (0-1000) was deemed satisfactory. In addition, siMPle software (Primpke et al., 2020) was used whose hit quality range lies between 0.01 and 1 and a threshold of 0.7 was used for making the final decisions on the material types, as hit qualities were higher than in OPUS.
2.6. Statistical analysis
All survey data were converted to count or weight per square meter to enable comparisons. To analyze the data, we investigated two factors that could influence the abundance, weight, and composition of beach debris. The numerical factors “transect area size” and “number of observers” were recorded upon landing, although for some transects the size had to be calculated afterwards, using photos and digital measuring tools.
Analyses were run on data from all beaches, excluding the big pack beaches Kiepertøya 1 and 2 and Tommelen since elaborate methods used in the laboratory were not comparable with the beach surveys. The relationship between total mass or abundance and the numerical factors “Transect area size” and “Number of observers”, was assessed using the Spearman rank order correlation and the Pearson correlation with Minitab 18.
3. Results
3.1. Arctic beach debris surveys
3.1.1. Abundance of beached debris
Overall, on all nine beaches, 8,299 pieces were collected on a total area of 19,000 m2, resulting in 0.27 pieces of debris m-2 (Figure 1). However, the mean of all nine beaches was 0.37 items m-2 (± SEM = 0.17). The most common material observed was plastic (99.6%), including both general (76.9%) and fisheries/shipping plastic (22.7%) (Figure 1).
The highest abundance was recorded at Sørvika and Wigdehlpynten (1.3 items m-2) with general plastic dominating (Table 1). In contrast, no debris was found in transects on Boltodden and Gåshamna, the only two beaches that were only sampled by one (albeit very experienced) person. In addition, Boltodden was characterized as “open ocean”. The only location, where more fisheries/shipping plastic than general plastic was observed was Wijkanderøyane (93% versus 7%). Table 1 summarizes the characteristics, debris quantities and composition of all beaches.
The Spearman’s test for the number of debris items and our two numerical factors showed a significant positive correlation for “transect area size” (N = 9, rho = 0.76, p = 0.020) and “observer number” (N = 9, rho = 0.86, p = 0.003) indicating that a larger transect area or a higher helper number correlates with higher debris abundance.
3.1.2. Mass of beached debris
The citizen scientists collected a mass of 1,147 kg of debris on roughly 30,800 m2 of transect area over the course of this study giving a total of 37 g m-2. The mean of the mass recorded on the fifteen beaches was 41.83 ± 31.62 g m-2, of which 98% were made of plastic overall (Figure 3). Fisheries-related plastic accounted for 90% of the plastics and general plastic for 8%. The highest mass was collected at Reindiersodden (483 g m-2), where a very heavy rope fender dominated the mass and resulted in nearly 100% fisheries/shipping plastic for this beach. The next highest masses were recorded at Brucebukta (27 g m-2) and Alpiniøya (24 g m-2), again dominated by fisheries-related plastics (58% and 90%, respectively). On Crozierpynten, Krossfjord and Isflakbukta fisheries-related plastic did not dominate. However, fisheries-related metal dominated (54%) at Crozierpynten, in the north, followed by the composition on Krossfjord, in the west, and Isflakbukta in the high north, where general plastic dominated (63% and 49%, respectively). A summary of all beach characteristics, debris mass and composition is given in Table 2.
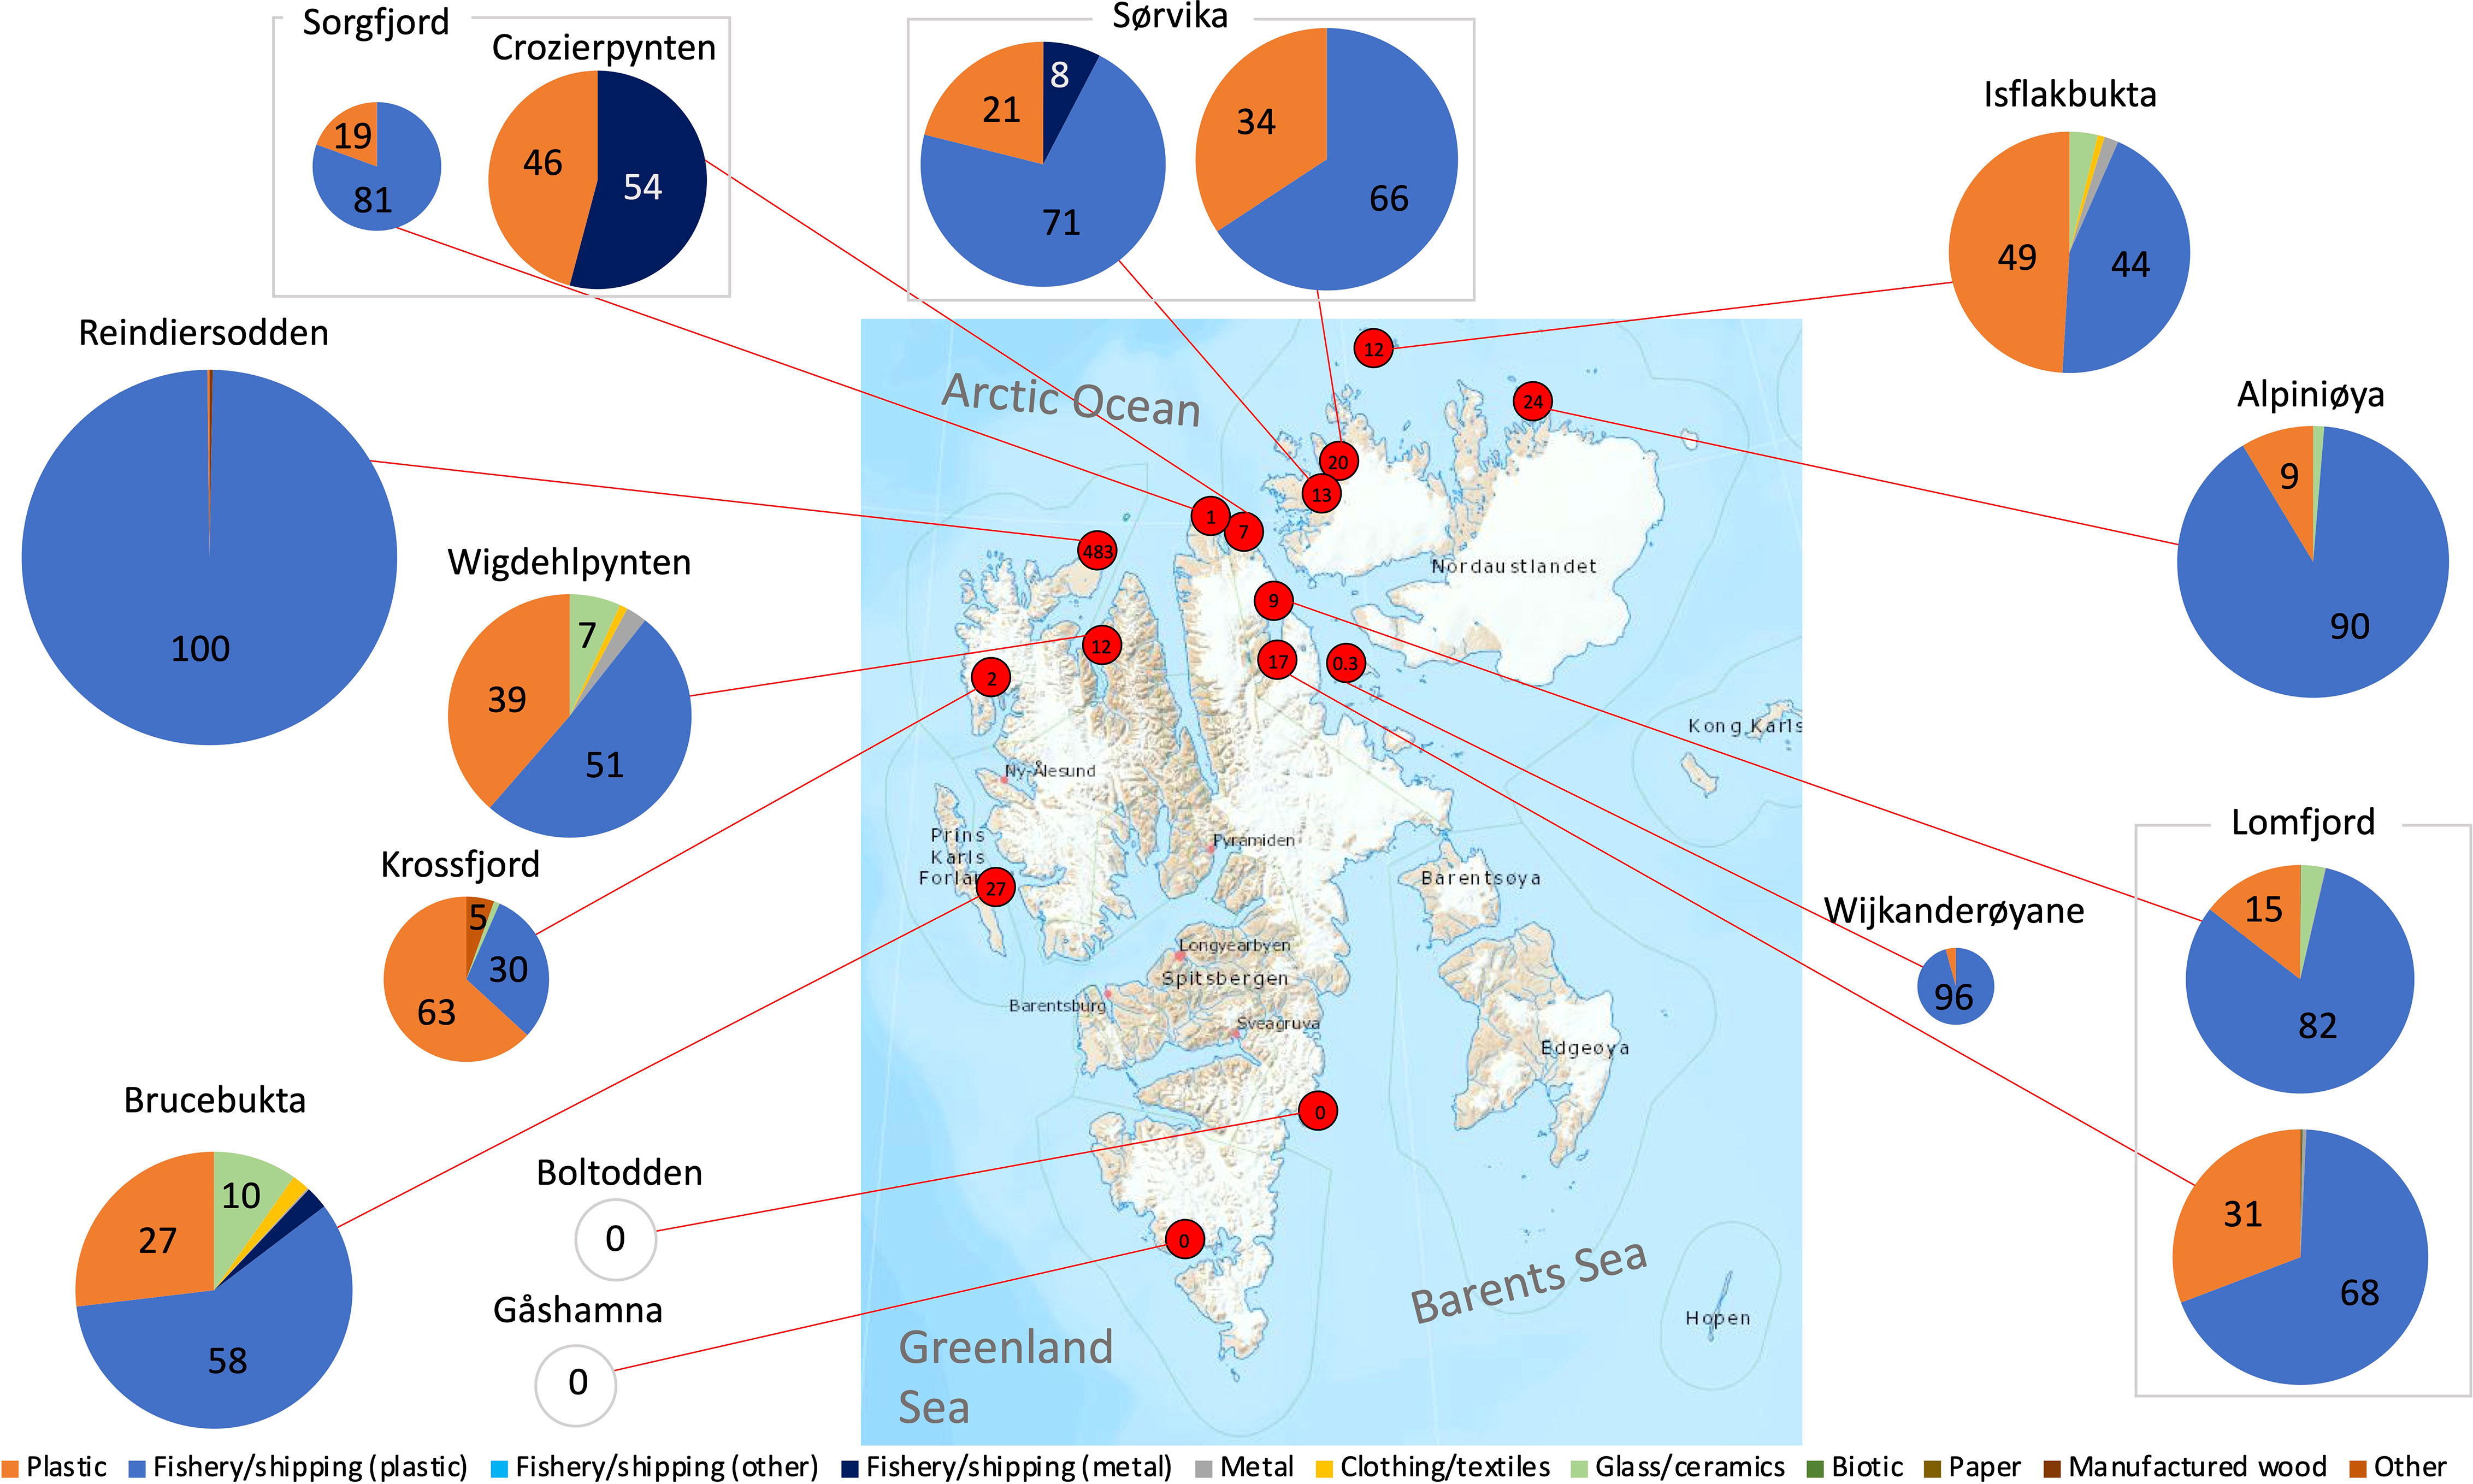
Figure 3 Map of all locations of beach debris surveys (mass) depicted by red dots with the mass in g m-2, which is also scaled by the relative size of pie charts showing the rounded proportions [%] of debris categories. Log (x+1)-transformed mass was used to improve the graphic representation (Map © Norwegian Polar Institute).
The Spearman’s test suggests a significant positive relationship between the mass of debris and observer numbers (N = 15, rho = 0.659, p = 0.007), implying that a higher number of observers collects a greater debris mass. With a larger data set, a correction factor could be calculated to account for this source of variability. However, the restricted number of surveys undertaken, does not yet suffice to produce a robust correction factor. Executing the test without outliers, did not affect its outcome. There was no significant correlation between transect area size and debris mass.
3.2. High-resolution debris composition of three big packs
Since no data on the abundance of big pack 2 (Tommelen) were recorded, only the mass of all three big packs is described in the following section. The debris from the three big packs collected on Kiepertøya and Tommelen was examined more thoroughly than is possible on Arctic beaches. Some 240,000 g (62 g m-2) of debris were inspected from the first big pack (Kiepertøya, 2017). The second big pack (Tommelen, 2019) weighed ca. 60,000 g (97 g m-2) and the third (Kiepertøya, 2021) contained ca. 167,000 g of debris (66 g m-2) (Table 3).
“Plastic” dominated in all three samples (Figure 4). “Fisheries/shipping plastic” accounted for the greatest share. However, the big pack from Tommelen had a lower proportion of fisheries-related plastic (58%) compared to both Kiepertøya campaigns (78 and 92%). Nets and ropes were the most common items in this category, followed by large containers, such as buckets, canisters, and jerry cans.
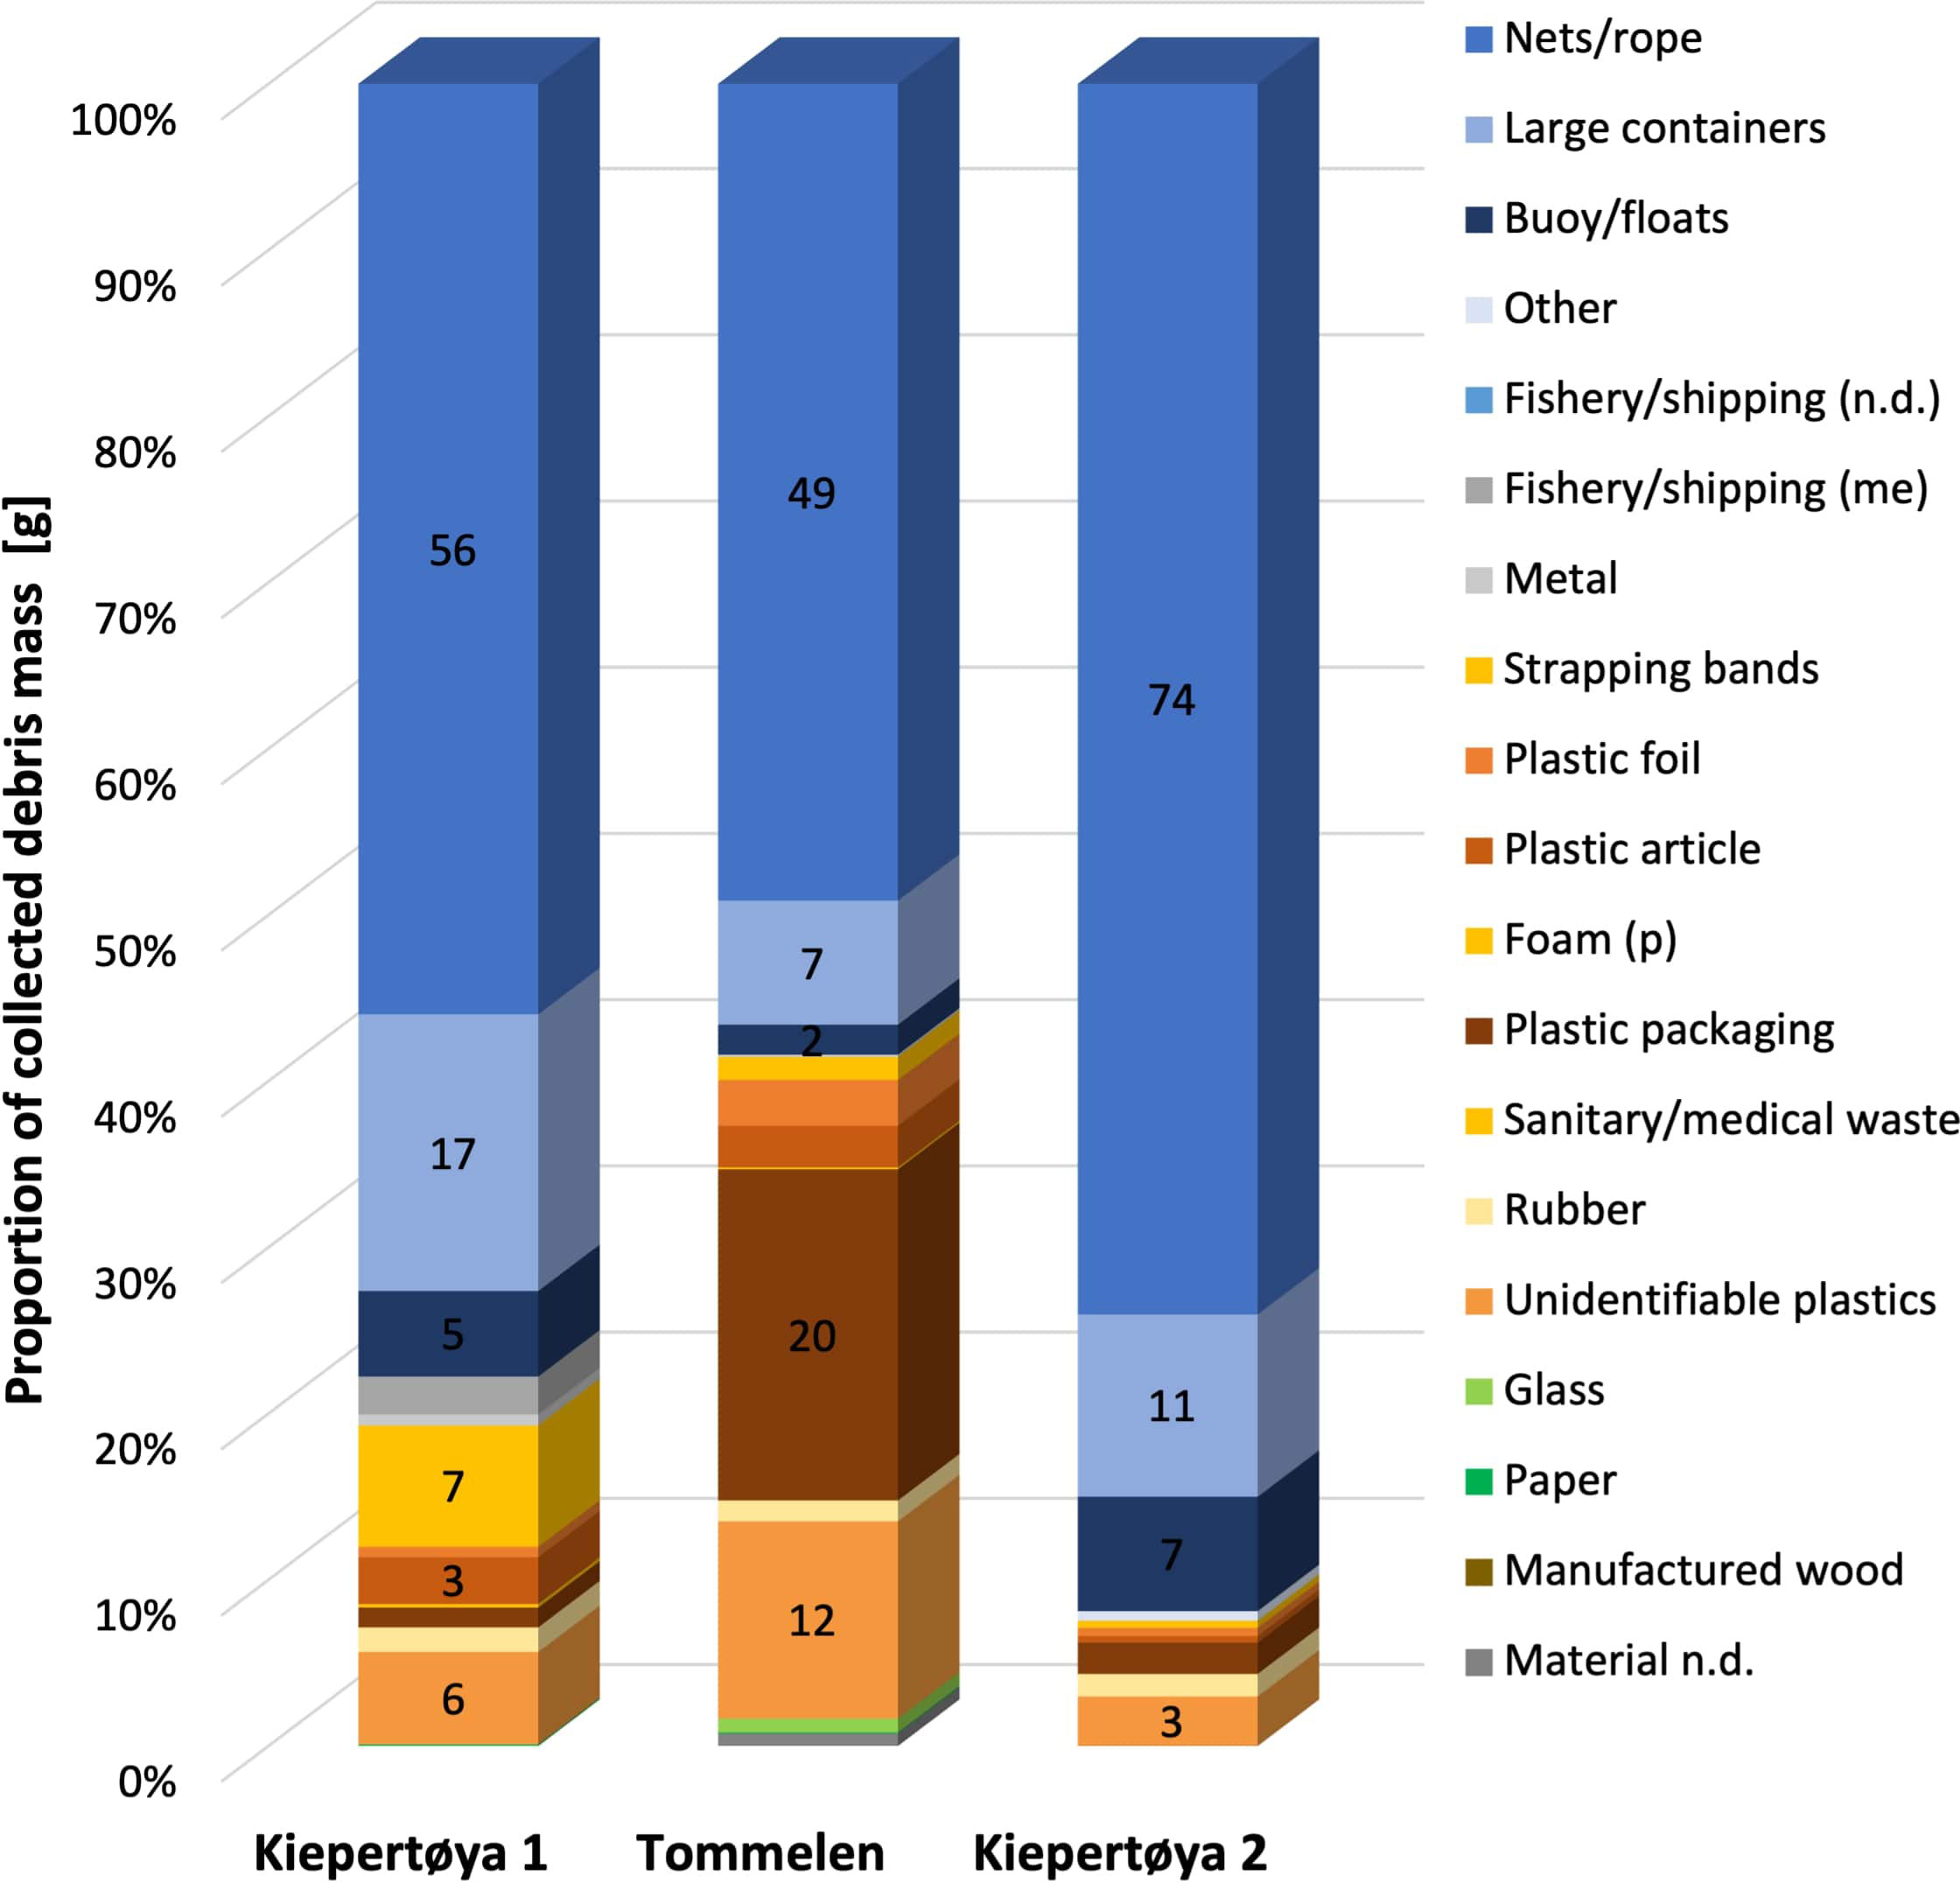
Figure 4 Detailed composition of beach debris categories (%) based on mass [g]. (n.d. = not defined, m = metal, p = plastic).
The two big packs from Kiepertøya had a similar composition of debris. On Kiepertøya 1, besides fisheries waste, strapping bands (7%), unidentifiable plastics (6%) and plastic articles (3%), were categories that showed a higher proportion compared to others, such as rubber and foam. The second transect on Kiepertøya, where the highest mass of “Fisheries/shipping plastic” was recorded (92%), showed heavier amounts of unidentifiable plastics (3%) and plastic articles (2%). By contrast, the sample from Tommelen was characterized by plastic packaging (20%) and unidentifiable plastics (12%). This highlights unidentifiable plastics, strapping bands, and plastic packaging and articles as important debris categories. However, fisheries-related waste constituted still the largest portion of debris mass recorded.
3.3. Provenance of Arctic beach debris
3.3.1. Composition of provenance in three physical samples
The provenance was determined for 359 pieces from all three big packs (Figure 5). One percent of all items was identified out of the big packs from 2017 and 2021. The second big pack had to be omitted for this calculation as there were no overall abundance data available. Twenty-seven countries were identified in total, excluding the categories “English language” and “Global” (Table 5).
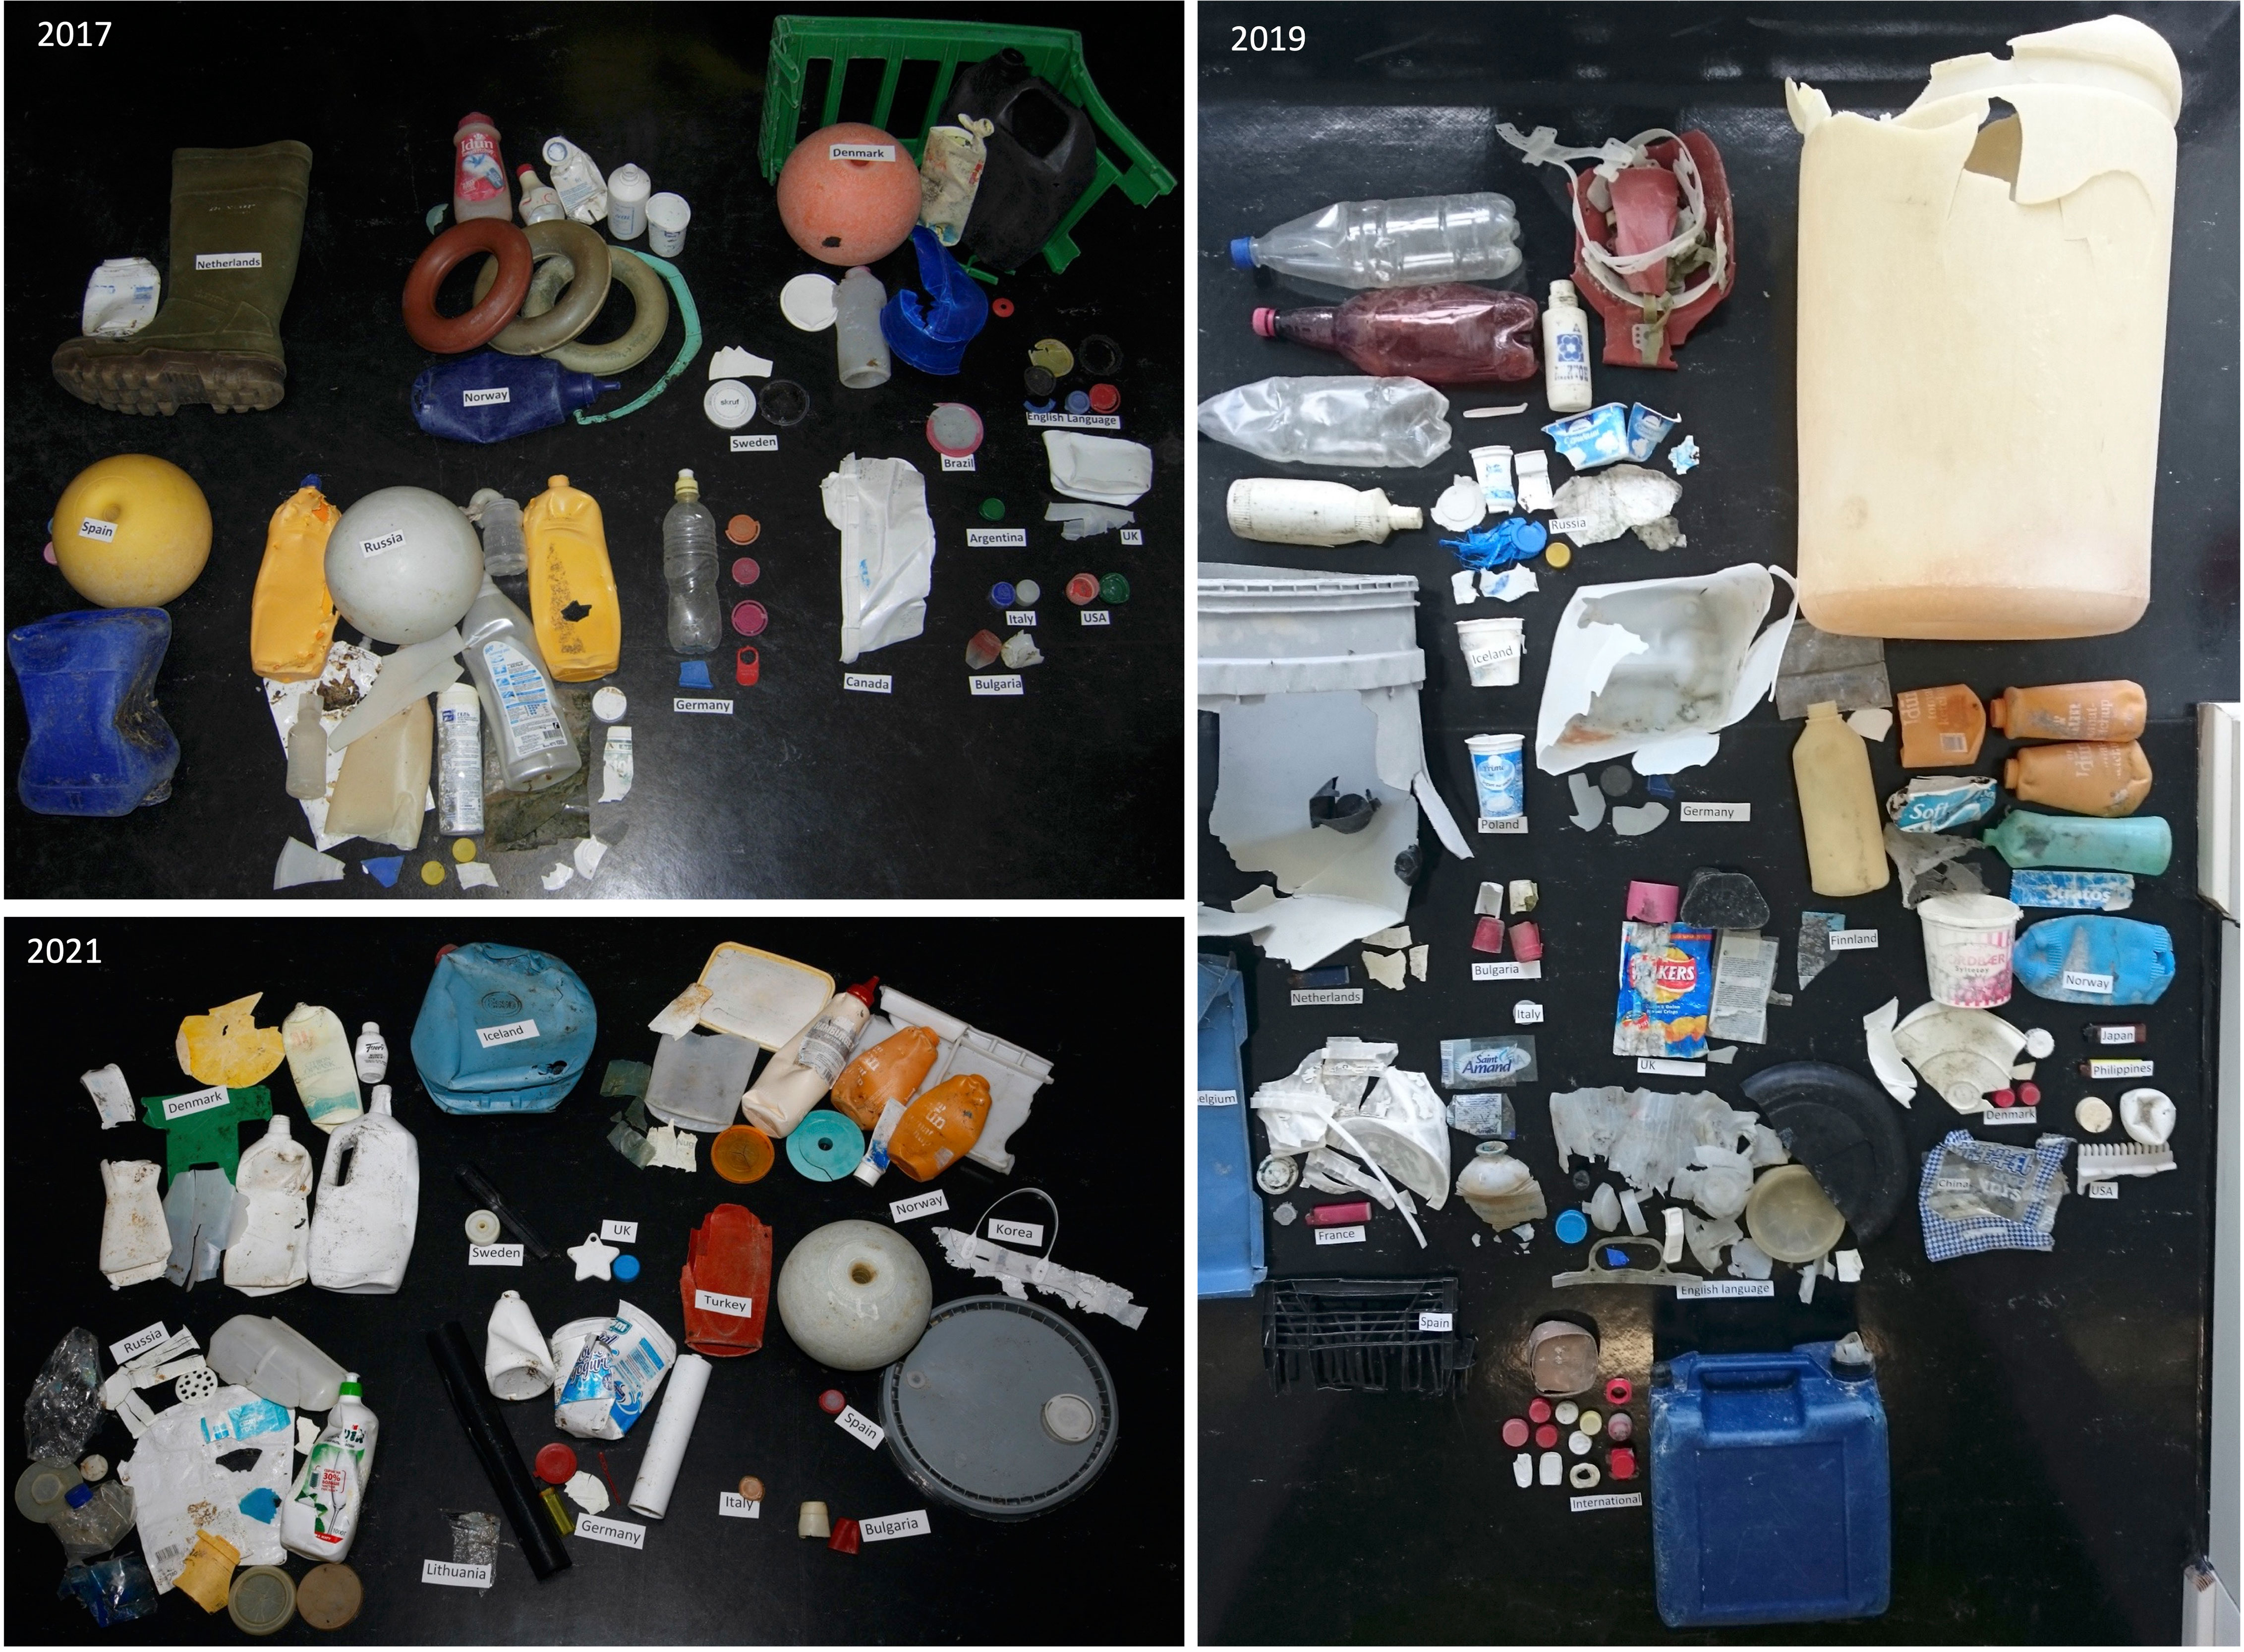
Figure 5 Items of determined provenance from 2017, 2019 (© M. Bergmann) and 2022 (© J. Hagemann).
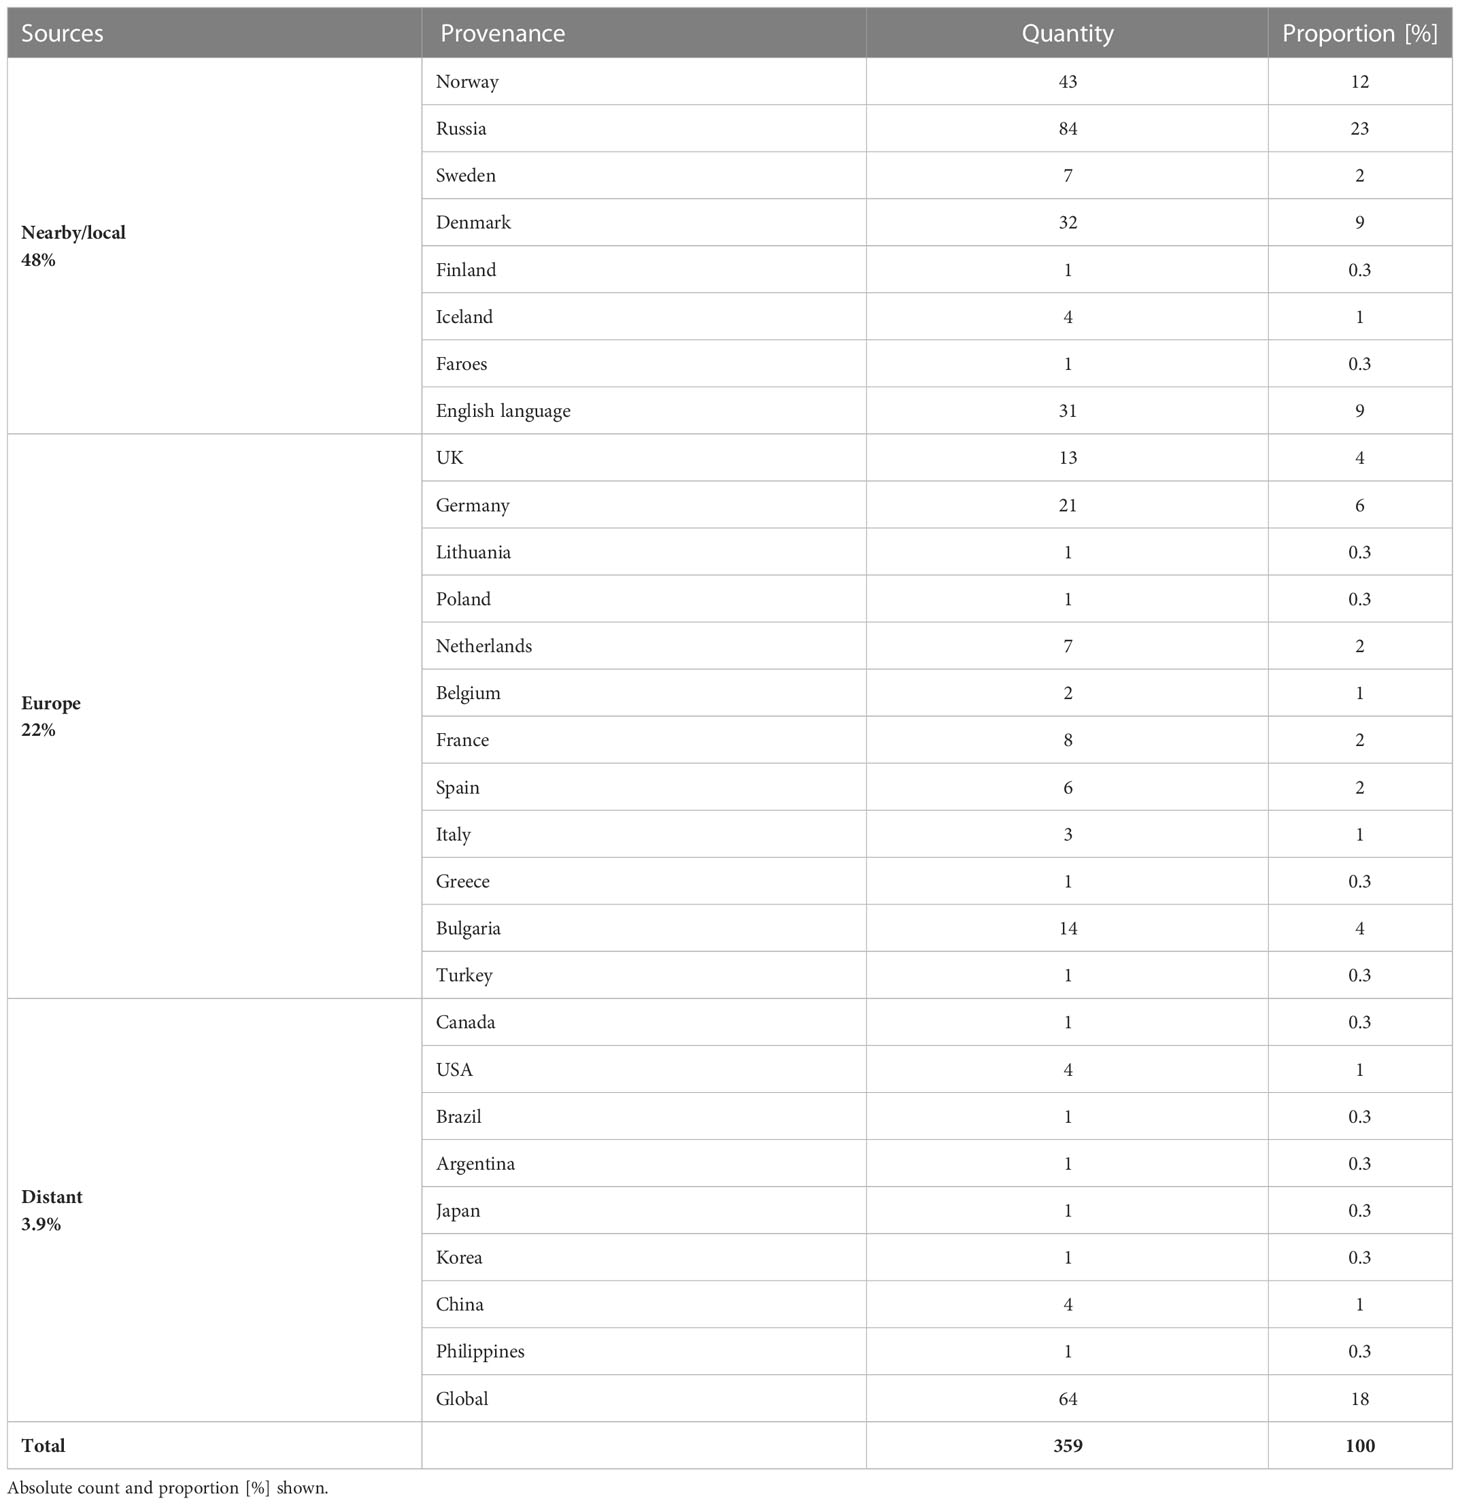
Table 5 Summary of provenance identified (three big packs pooled) in order of proximity to Svalbard categorized into source regions.
Regarding the pooled data of all big packs, the countries contributing the most were located closer to Svalbard (48%) such as Russia (23%), Norway (12%), and Denmark (9%). Note that Greenland is associated to Denmark, which makes it difficult to determine from which location items originate unless specified. Although Sweden, Iceland and Finland are Arctic states and relatively close to Spitsbergen, their share was low (< 4%). Other European countries such as Germany (6%), the UK (4%), Spain (2%) and others accounted for 32% of the debris analyzed. This includes “English language” (9%), which is likely of UK provenance although this is not 100% certain. The category “Global” accounted for 18% and the remainder was of more distant provenance including American countries (2%) and Southeast Asia (2%). Combined they contributed 14 items to the whole of 359 pieces. While the USA and China had four debris pieces each, other countries classed as American and Asian only contributed one piece each. If the categories ‘global’ and ‘English language’ were excluded, most of the identifiable items originated from Arctic states (65%), especially from Russia (32%) and Norway (16%) (Figure 6). But almost a third of the items (30%) was of European provenance, especially from Germany (8%). Items of very distant provenance accounted for 5%.
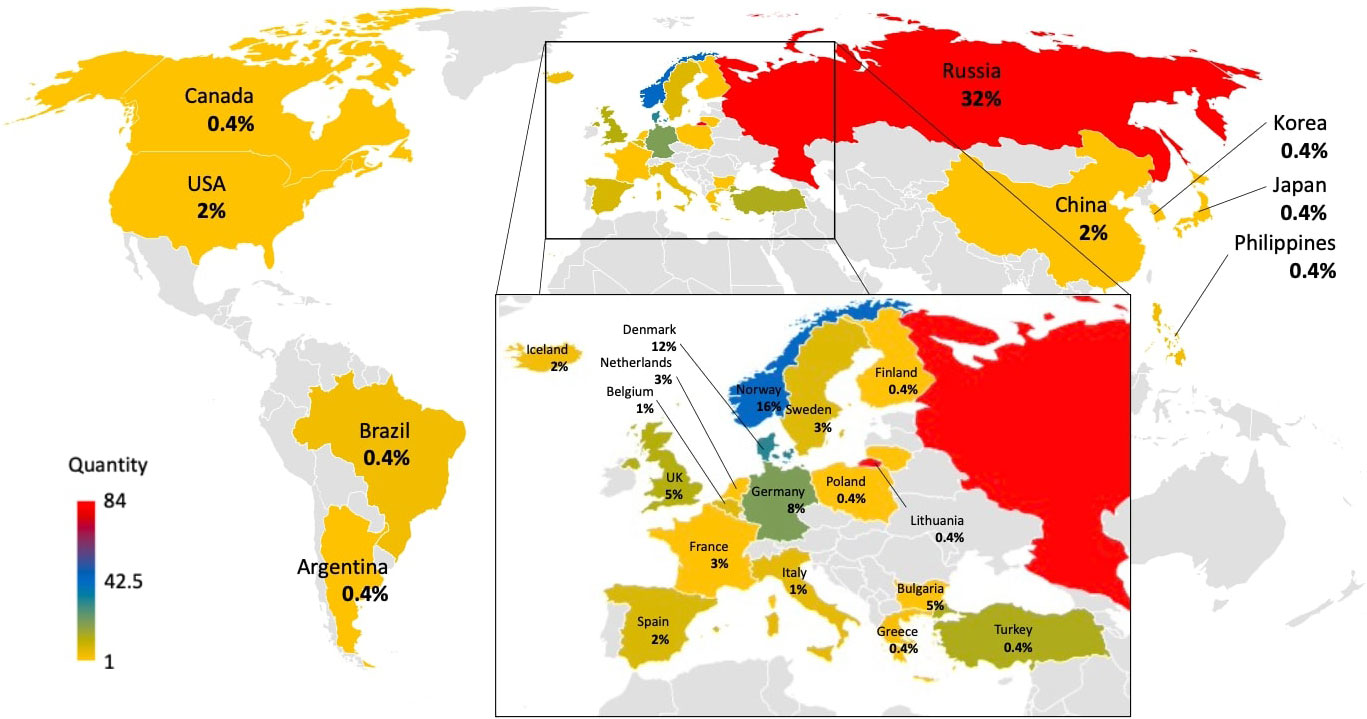
Figure 6 Origin of items depicted in a map. Countries and proportions marked, color of countries show number of assigned items.
3.3.2. Temporal trends regarding provenance of items
The proportion of the category “global” grew every year, from 6% in 2017 to 30% in 2021 (Figure 7). Interestingly, Norway (11-13%) and Denmark (7-13%) remained quite constant, whereas Russia (18-28%) showed a 10% increase over time. Norway and Russia register a slight decline in absolute numbers. The consistency in numbers also applies to Germany and the UK, where the debris quantities differ between 4-9% and 2-5%, respectively. While the decline also applies to the UK, it does not apply to Germany, where the numbers vary from sampling to sampling. More distant sources had a small but consistent share of debris over time (<5%). No statistical tests were done because of the small data set.
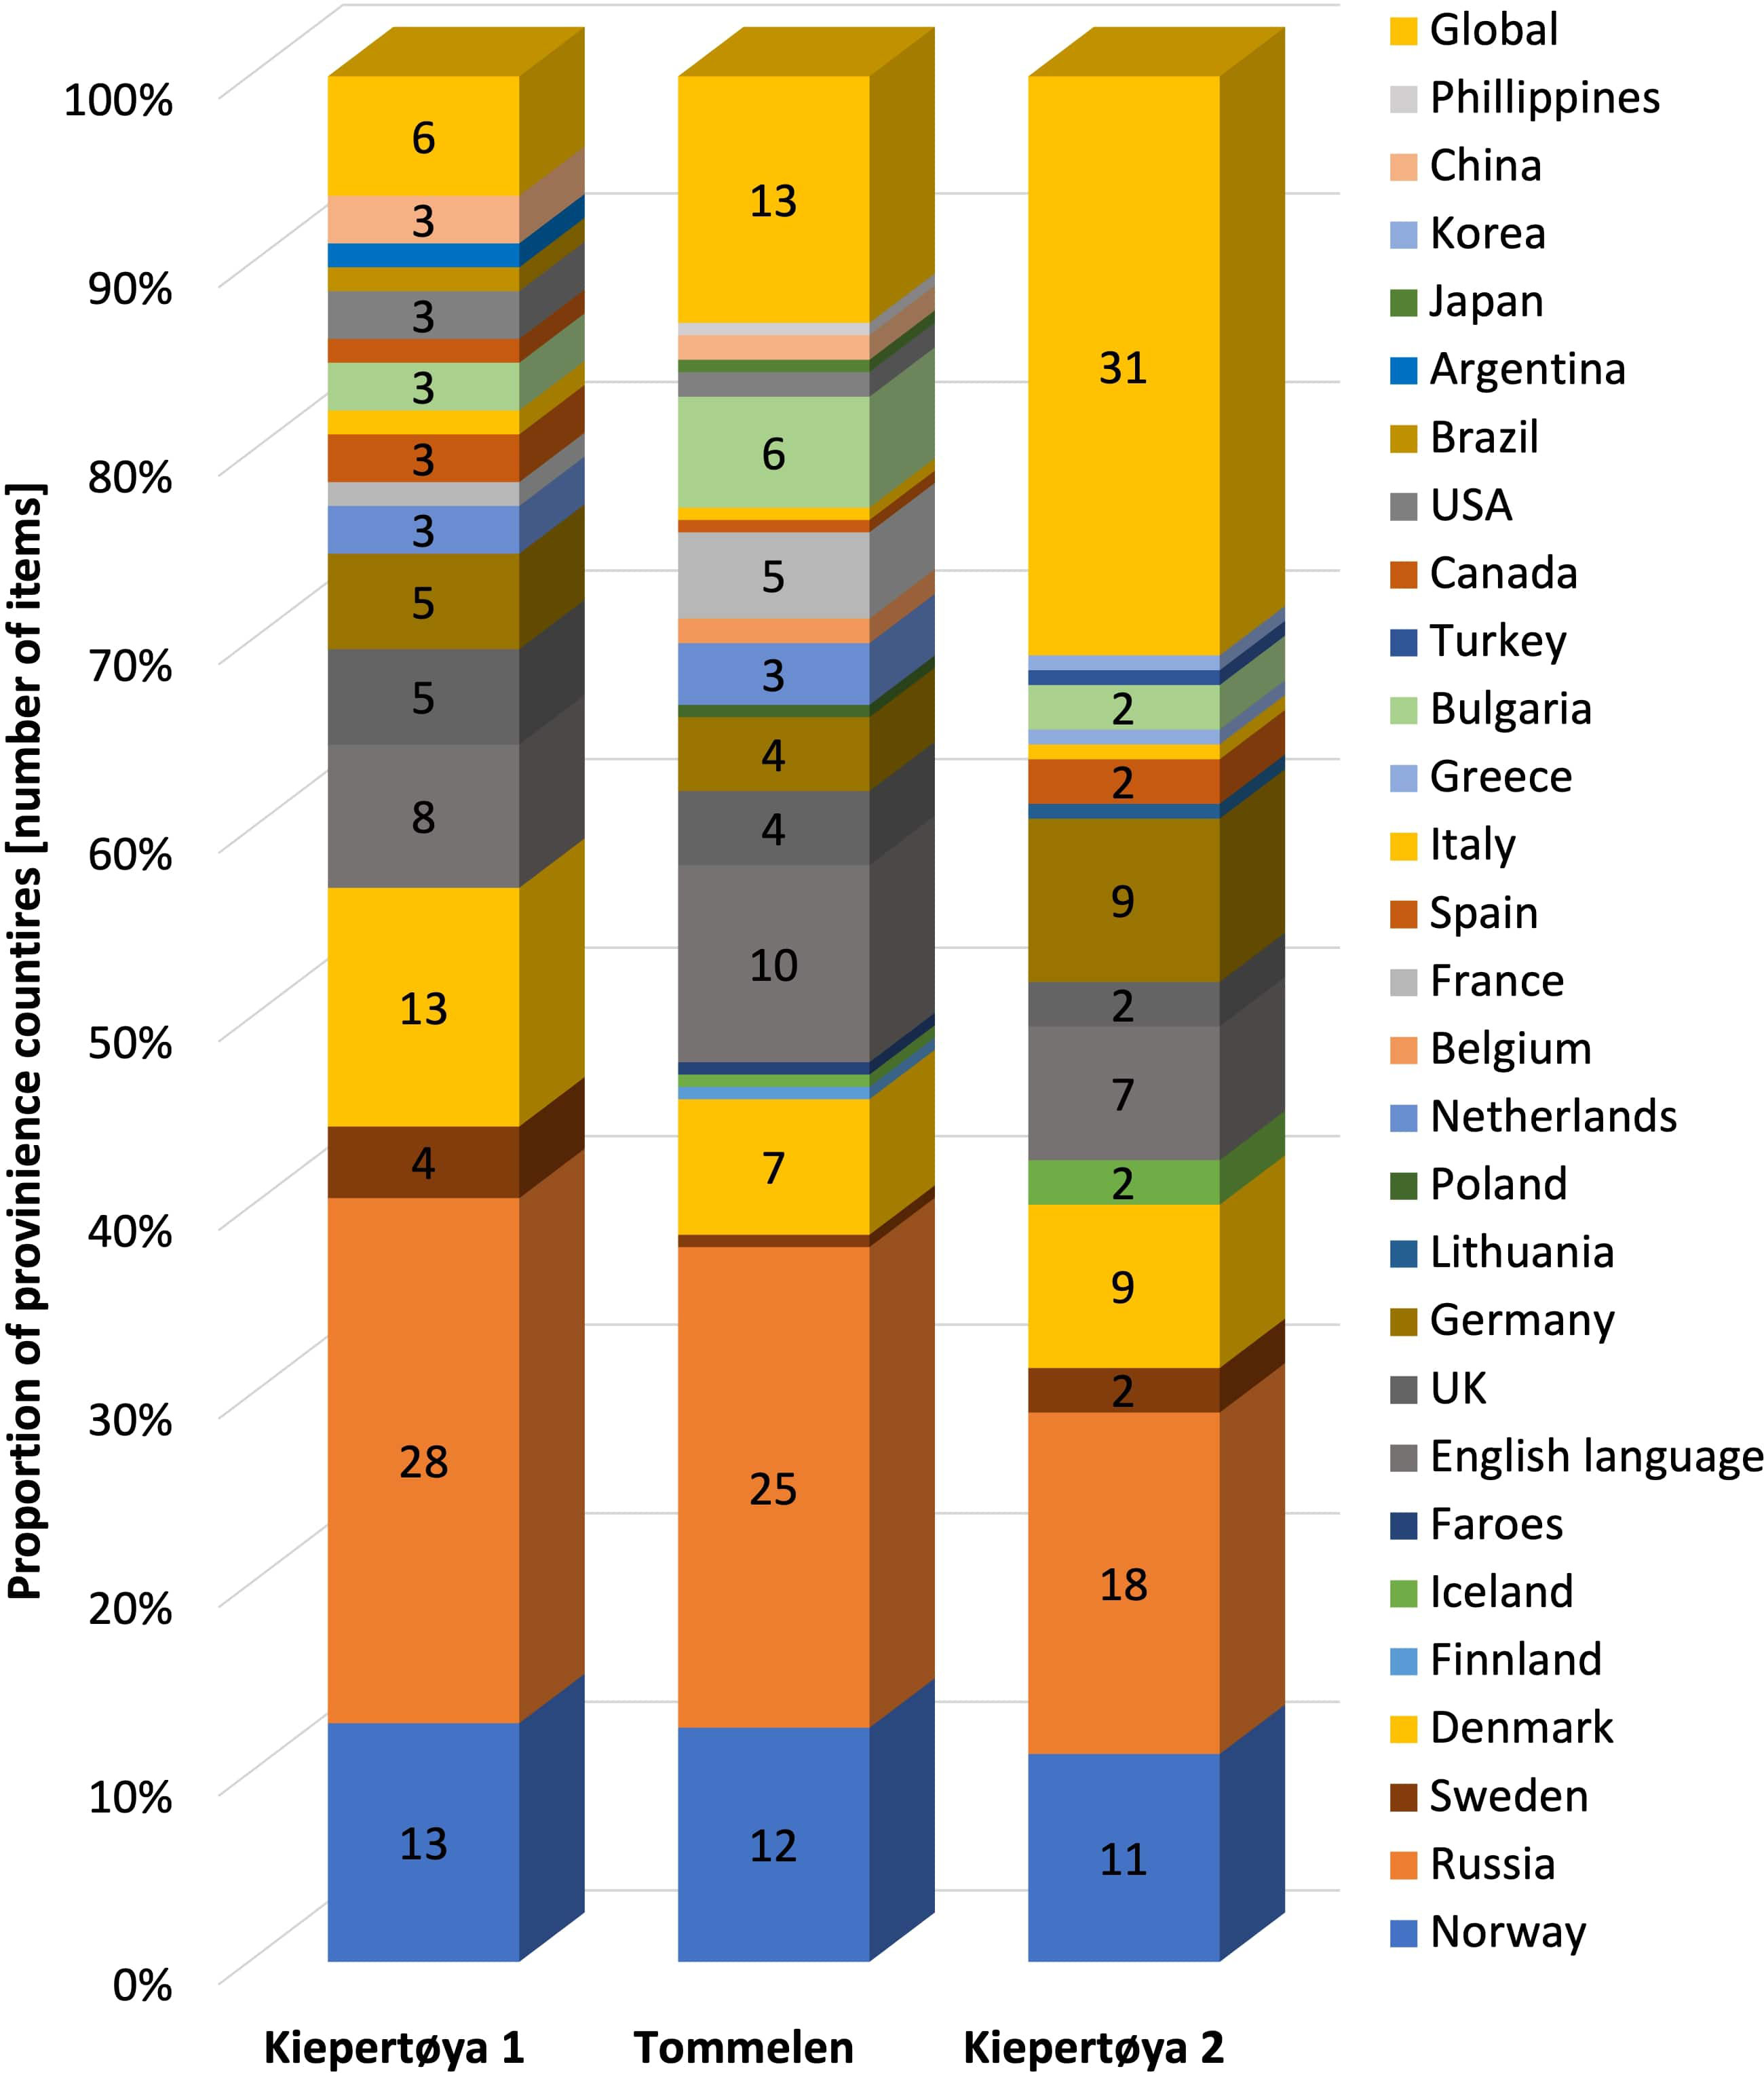
Figure 7 Proportions of marine debris of different provenance in three samples collected from Kiepertøya (2017), Tommelen (2019) and Kiepertøya (2021) from items that still showed signs of provenance.
3.4. Date prints
Date prints were identified from 21 items out of 270 provenance items (8%) and ranged from 1960 to 2013. Ten pieces (48%) dated to the period between 2000 to 2013. The oldest piece found is a bottle fragment, which is likely from around 1960. Supplementary Table 1 provides a list of all date prints and the articles provenance if applicable. Out of the 21 items with date prints, 71% (15 pieces) also bore signs of provenance and included Germany (27%), Norway (20%), Russia (Soviet Union), Denmark and the UK (13%), respectively, and the Netherlands (Holland) and Turkey (7%, respectively). The most recent production date which was estimated to be between 2012 - 2013, was from a German shoe. Other interesting finds included a helmet from the Soviet Union (1979) and a large container from Norway (1971).
3.5. Polymer composition of selected items
Out of 224 provenance-items for which physical samples from 2019 and 2021 were still available, 15 different polymer types could be identified. Polyethylene (PE) accounted for 61% of the items, 50% of which were high-density (HD) and 11% low-density (LD) PE. Polypropylene ranked second (31%). Poly(diallyl isophthalate) (0.4%) and polyurethane (0.4%) were less common. Supplementary Table 2 provides a summary of the proportion of polymers recorded. All nets and ropes analyzed were synthetic (70% polyethylene, 30% polypropylene) and 95% of the strapping bands were made of polypropylene. The remainder consisted of HDPE.
4. Discussion
4.1. Citizen science data generated during beach clean-ups
This study relied on citizen scientists to generate reliable data during clean-ups on Arctic beaches, which expands our knowledge of plastic pollution in a remote and under-researched part of our Earth (Bergmann et al., 2017a). Citizens are often eager to contribute to environmental science, especially in terms of debris pollution, which is a tangible and topical issue, even for children (Hartley et al., 2015). While it has the potential to improve science and ocean literacy among participants, there is uncertainty regarding the data quality since no scientist was present during the surveys (Aceves-Bueno et al., 2017). Therefore, it is important to ensure reliable data collection via (1) preparation of clear protocols, (2) training of the leading guide, (3) on site supervision and (4) the revision of samples and data (Hidalgo-Ruz and Thiel, 2015). All of the above but (3) were followed during the work presented. In addition, beach surveys are particularly amenable to citizen scientists who can draw knowledge from their daily life for the recognition of debris items (>2 cm) requiring only little additional training. Nevertheless, in most beach clean-up scenarios, the beach or transect cannot be cleared of all debris, as it is buried in sediments (Lavers and Bond, 2017) or due to a lack of time. This could underestimate the debris on beaches such that the numbers can be considered as conservative estimates. Other benefits are the spatial and temporal coverage of under-sampled areas (Nelms et al., 2017). Indeed, this study would not have been possible or covered as many sampling locations without citizen scientists. Kylin (2020) recorded 0.0011 items m-2 on a beach in the Russian Arctic, which is a two-magnitude lower abundance compared to a similar beach (Krossfjord, 0.2 items m-2) from this study. If citizen science produced erroneous pollution levels, these would likely have been lower due to debris oversight rather than much higher numbers. However, it could also be argued that this form of data collection could be more reliable, when more observers are included that cover a larger area and reduce the risk of overlooking items as indicated by the positive correlations found between debris and observer numbers or area covered.
Nevertheless, beach clean-ups as such come with uncertainty, such as a lack of information on the retention of beaches (Onink et al., 2021) and if and when the beaches had been cleaned prior to surveys. Data from different beaches may thus not be comparable as recently also suggested by Provencher et al. (2021), who criticized a frequent lack of baseline knowledge. However, the beaches visited here are very isolated such that some of them have probably never been cleaned. The oldest item identified was a bottle fragment from Norway, whose production likely dates back to the 1960’s. While it is unclear when exactly this piece washed ashore, it still gives the indication, that this particular beach (Tommelen) had not been cleaned for some time as also indicated by a piece of a Soviet helmet.
When it came to sorting and determining the composition of the physical sample from 2021 inconsistencies emerged as the methods applied in 2017 and 2019 differed slightly. For example, since the categorization on survey forms for the citizen scientists was refined over the years, we categorized the big pack accordingly, for consistency. Items such as strapping bands and plastic sheeting had been assigned to “fisheries-related plastics” in the first year. While this is likely true (Falk-Andersson, 2021), it is not 100% certain. So, in the following years they were listed separately, also when sorting the physical samples.
4.2. Arctic beach debris surveys
4.2.1. Debris mass
This study showed that plastic was present on most of the investigated beaches of Svalbard at a mean mass of 42 ± 32 SEM g anthropogenic debris m-2. This is high compared to a Bulgarian beach that harbored 2 g m-2 and was located near the third biggest town in Bulgaria (Panayotova et al., 2020). On New Zealand beaches, an overall mean weight of 9.17 ± 2.91 g m-2 of marine debris was recorded, which could be low due to local stewardship and clean-ups by tourists (van Gool et al., 2021) similar to visited beaches on Svalbard. The pollution levels were assessed on two remote South Pacific islands. While the mass density of surface plastic debris was 571 ± 197 g m-2on the uninhabited Henderson Island (5200 km northeast of New Zealand), 3164 ± 1989 g m-2 of plastic debris was recorded on Cocos Island (2750 km northwest of western Australia) (Lavers et al., 2021). Although these beaches are comparable to Svalbard, they had much higher amounts of debris compared to our data, which could be due to their proximity to the South Pacific Gyre, a known plastic accumulation zone. Although a debris accumulation zone has been projected for the Nordic Seas, too (van Sebille et al., 2012; Onink et al., 2019), the current stage of accumulation is uncertain.
The composition of the debris mass is dominated by fisheries-related debris (91%), 89% of these 91% being plastics, the rest being metal and other materials. This concurs with reports from Antarctica, where the shores of Bird Island and Signy Island saw 59% and 69% fisheries-related debris mass, respectively (Waluda et al., 2020). Likewise, in the North Pacific subtropical gyre, fisheries-related debris accounted for 90% of the mass (Lebreton et al., 2022). A common trait of remote and uninhabited areas could be that they harbor more sea-based debris than household-plastics, since recent estimates suggest that 2% of all fishing gear used globally could be emitted to the ocean every year (Richardson et al., 2022).
No debris was collected on Gåshamna and Boltodden, which could be a result of only one person surveying these beaches as supported by a positive correlation found between the number of observers and debris counts. Still, since these surveys were conducted by BL, who has organized clean-ups since 2016, this could be a coincidence. As both beaches happened to be located in the south of Svalbard it is conceivable that the currents carry debris further north, especially since Boltodden is exposed to the open ocean. All other beaches were located in fjords or bays, which might be more efficient at trapping debris. A Polish research station near Gåshamna could also affect debris abundance, as scientists may clean up its surroundings (Weslawski and Kotwicki, 2018).
4.2.2. Debris counts
A mean debris abundance of 0.37 ± 0.17 SEM items m-2 was recorded on Svalbard’s beaches, which classifies as “low polluted beaches” (Ansari and Farzadkia, 2022). Higher pollution levels were reported from beaches in Arctic Canada and West Greenland (1.4 ± 2.8 items m-2, (Mallory et al., 2021), which could be due to the influence of human habitation within 5 km of most sampled areas. By contrast, Russian Arctic beaches had pollution levels that were more than a magnitude lower on a mainland (0.024 debris items m-2) and island beach (0.011 debris items m-2) (Kylin, 2020). A possible reason for the difference between the two beaches could be the fact that the mainland is ice-free for a longer period and more exposed to fishing activity, thus more debris can wash ashore (Kylin, 2020). The connection between the declining sea ice extent and increasing fishing vessel numbers operating in the Svalbard region has been made before (Stocker et al., 2020) as has been the link between high fishing activity in areas of low sea ice concentration (Fauchald et al., 2021). It could be argued that an increase in vessel activities of any kind (fishing, merchant, tourist or scientific) increases the accidental or deliberate release of plastic debris in the region, which could explain the higher number of debris items found in our surveys. This was also concluded for increasing debris quantities on the deep seafloor west of Svalbard (Tekman et al., 2017). A larger mean mass of debris was found on the more northern sites of Svalbard, though most surveys were done in the north compared with only two in the south. However, no firm conclusions can be drawn since more evenly distributed surveys would be needed for balanced comparisons. This highlights one limitation of our citizen science setup, where site selection could not be based on scientific criteria.
Comparison of debris quantities in different ecosystem compartments could help us to identify hidden sinks of plastic accumulation and to address the open question ‘Where is all the plastic?’ (Thompson et al., 2004). If the mean count is converted to items km-2 to enable a magnitude-scale comparison with data from the nearby Fram Strait obtained during the same time period, it is obvious that mean quantities are highest on beaches (370,000 items km-2) followed by the seafloor (3,485 items km-2 (Parga Martínez et al., 2020)) and the sea surface (11 items km-2, (Tekman et al., 2022a)). The two and five orders of magnitude differences support the realization that beaches are important accumulation areas of marine debris (Onink et al., 2021; Haarr et al., 2022; Isobe and Iwasaki, 2022; Tekman et al., 2022c).
Our data showed that most debris was plastic in terms of both abundance (99.6%) and mass (98%), when adding up all beached debris collected on the nine occasions where both abundance and mass was recorded. The dominance of plastic is not surprising since many studies have shown that plastic and artificial polymers form the majority of marine debris (Vesman et al., 2020; Mallory et al., 2021; Ansari and Farzadkia, 2022) and that most marine debris in the Eurasian Arctic is fisheries-related (Bergmann et al., 2017a; Nashoug, 2017; Jaskólski et al., 2018). Our mass percentage of 98% plastics is substantially higher than the global estimate for beaches, which is 76% but comprises both count and mass estimates (Tekman et al., 2022b) from more than 2,600 locations worldwide including urban regions with a potentially higher diversity of debris sources. In addition, items from distant sources made of material such as paper and metal could degrade before reaching the Arctic.
The difference between mass and counts also transpires when comparing the debris composition of 14 Arctic beaches. The heaviest category is items from the fishing industry, which enter the environment at sea, a direct path of entry (local sea-based source) (Strand et al., 2021). The importance of local sea-based sources of Arctic debris is supported by reports of fast-sinking glass debris on the ocean floor (Bergmann et al., 2022b). Local debris emissions from increasing shipping activities could also act as a source of plastic pollution (Tekman et al., 2017; Tekman et al., 2020). In comparison, the category ‘general plastics’ accounts for the highest debris quantity recorded (80%) in terms of counts, pointing to land-based sources or also to ship waste since some items are universally used (e.g., cleaning agents, food packaging). Still, the presence of larger items, such as big food tubs point to ship galleys (Nashoug, 2017). Based on the date of manufacturing and provenance information, Ryan et al. (2019) concluded that most bottles collected on a remote beach in the South Atlantic stemmed from ships.
4.3. Comparing two physical samples
The difference between mass and abundance is particularly evident when comparing the compositions of two physical samples, where mass is dominated by fishery waste (80 – 92%) whereas general plastic dominated in terms of abundance (80 – 85%) (Figure 8). While the heaviest fishing net in our sample weighed 70 kg, it accounted only for one item, demonstrating why fisheries debris has such a high impact on mass composition. Similarly, in a study by Ryan et al. (2020), a small number of macro-debris items accounted for the greatest mass whereas “unidentifiable plastics” dominated in terms of abundance (41 – 50%), which is not surprising, as this category often comprises a high number of small, nearly mesoplastic-sized fragmenting items. Small, unidentifiable plastic debris and foam particles were also most abundant on the Western Black Sea coast (Topçu et al., 2013). Strapping bands (15 – 20%) came second highest in abundance, similar to observations in the Russian Far East (Jaskólski et al., 2018) and the Siberian Arctic (Vesman et al., 2020) and floating debris surveys in the Arctic and Northeast Atlantic (Tekman et al., 2022a).
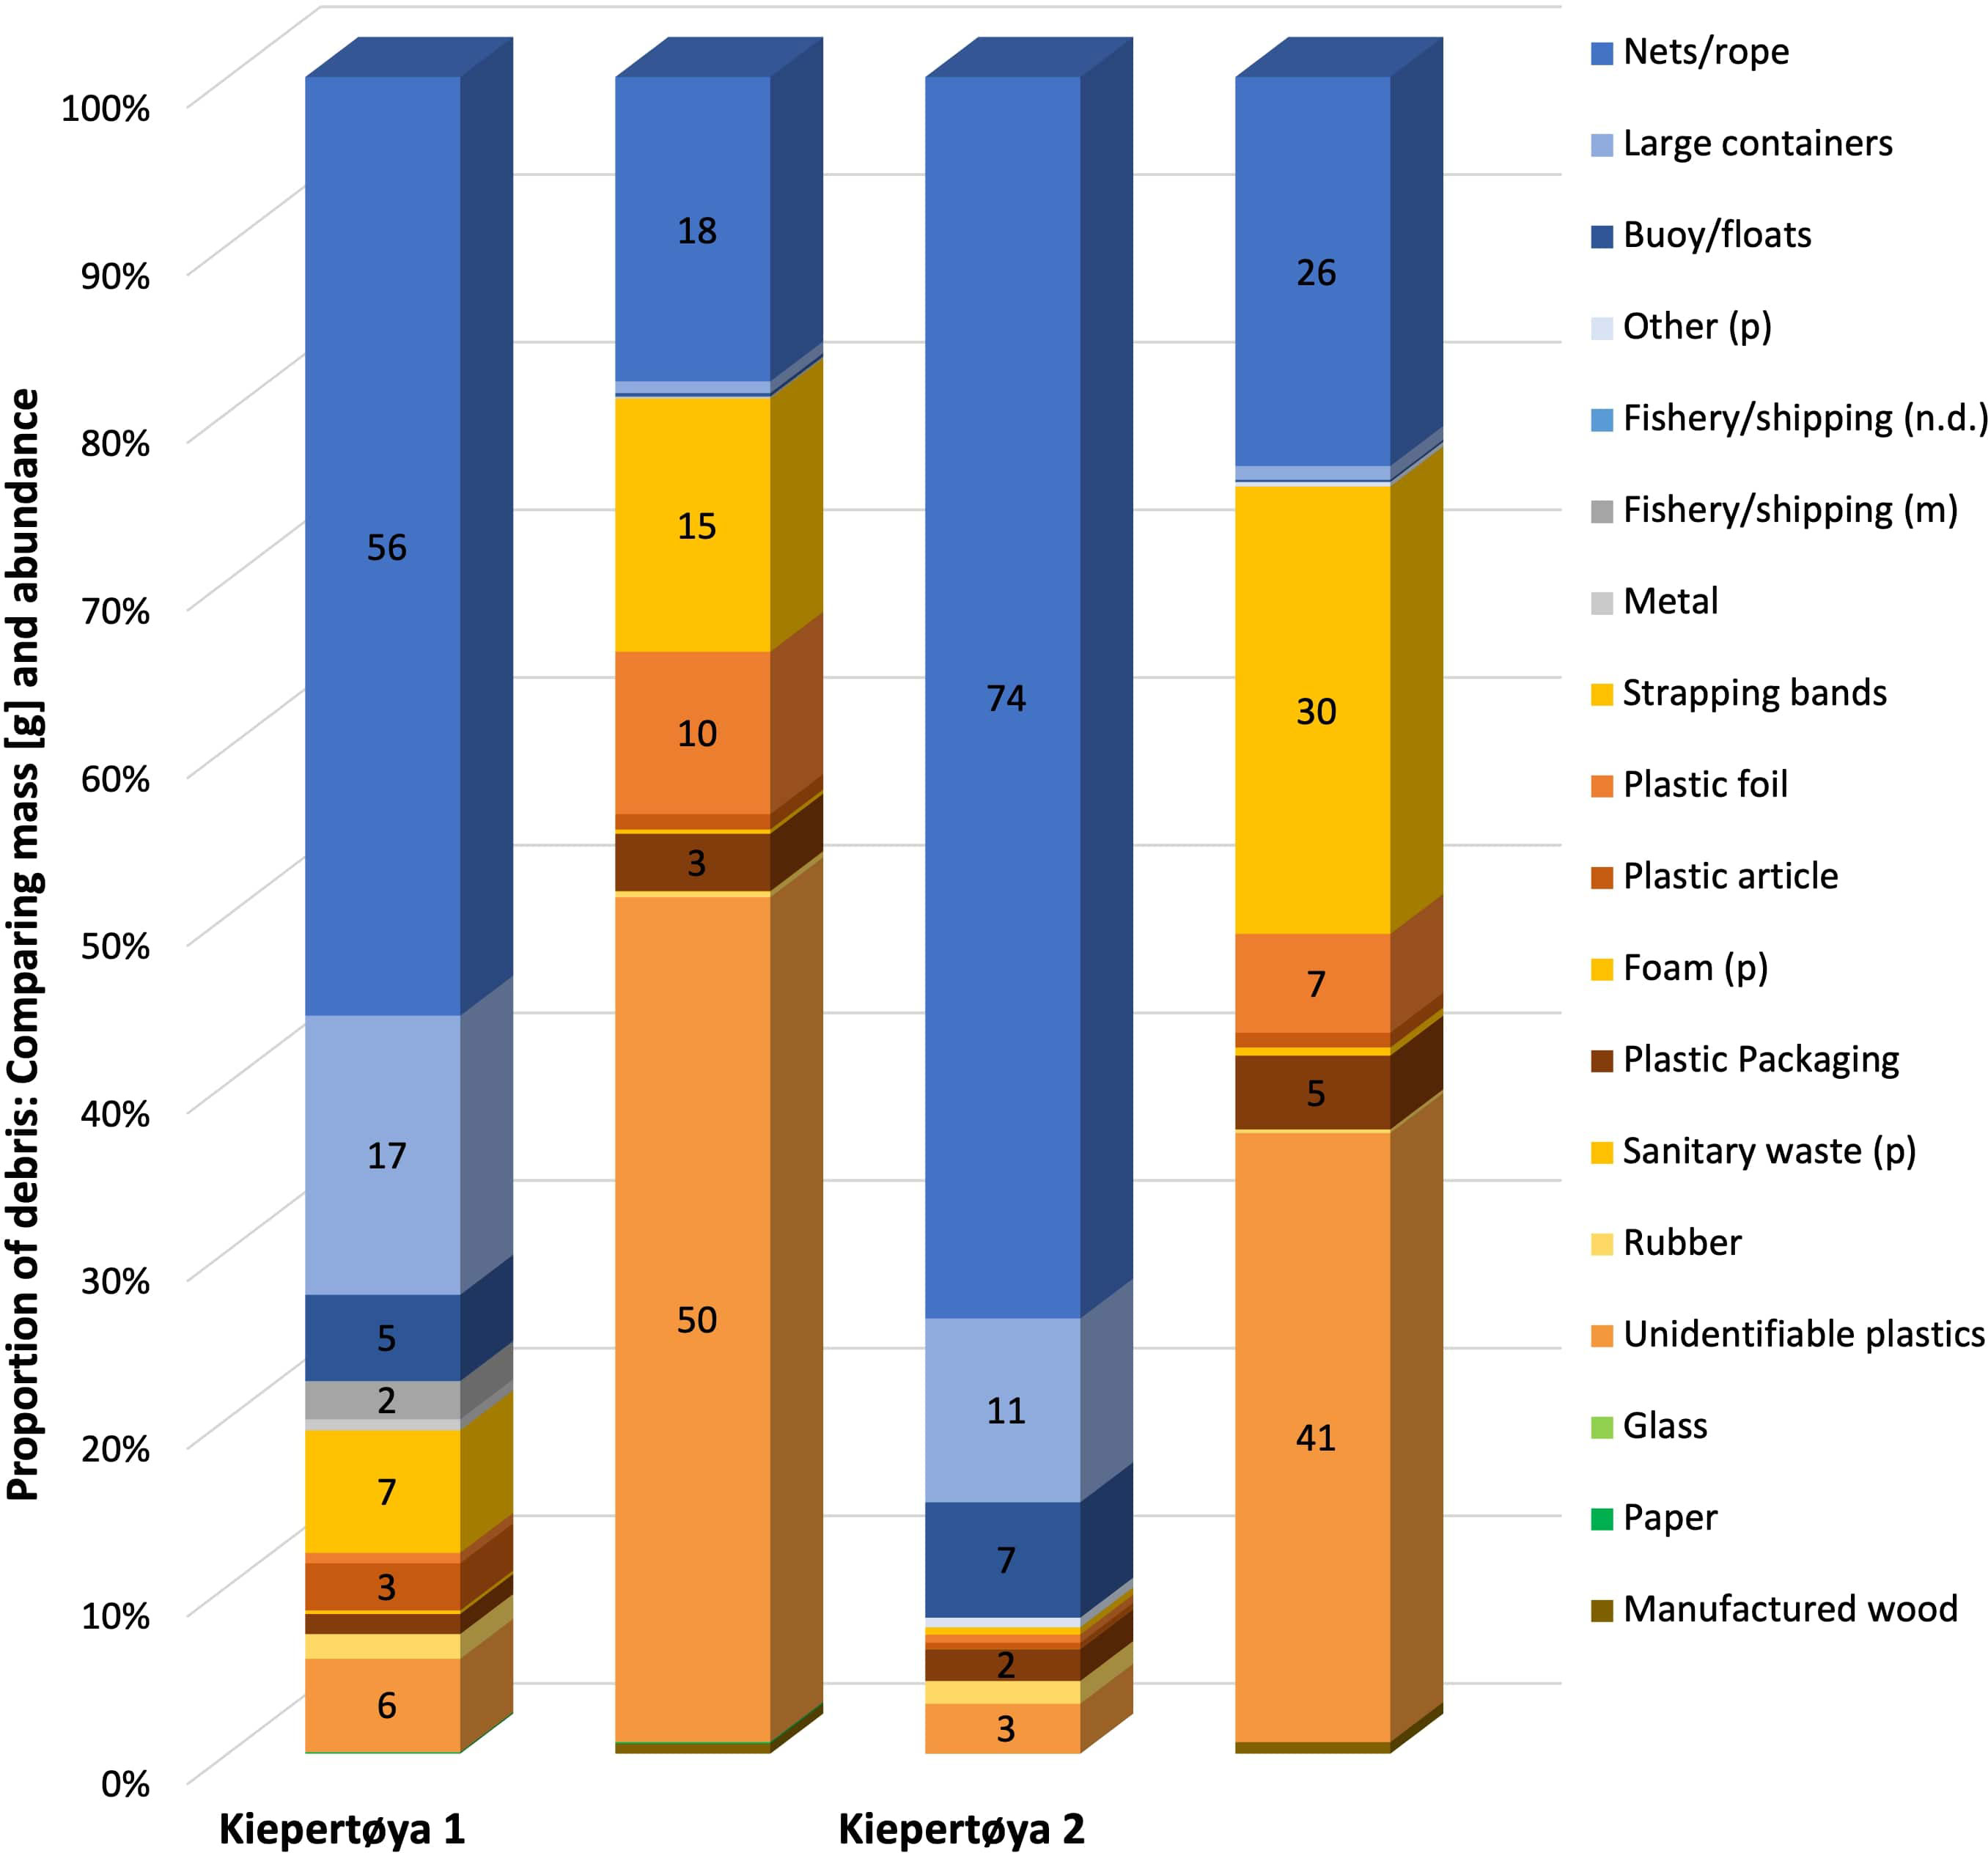
Figure 8 High-resolution proportion of two big packs. Two columns are shown per location: mass (left columns) and abundance (right columns). P = plastic, m = metal, n.d. = not defined.
4.4. Provenance of plastic items
Most debris that still bore signs of origin, seemed to have been produced in countries in close proximity to Svalbard, such as Arctic states including Russia, Norway and Denmark. This also corroborates the assumption, that much of the marine debris in the Norwegian continental shelf and Barents Sea is of regional provenance (Buhl-Mortensen and Buhl-Mortensen, 2017; Strand et al., 2021). However, almost a third of the items were of European provenance including countries bordering the North Sea or the North Atlantic such as Germany, UK, Netherlands, France and Spain. This is not surprising since particles drift northwards from the North Sea or East Atlantic towards the Norwegian, Barents and Greenland Seas in the time frame of more than a year from central Europe (Strand et al., 2021). The Atlantic circulation, which feeds the West Spitsbergen Current (Bergmann et al., 2016), transports the debris to the north where it washes ashore (Nashoug, 2017). However, debris items could also have entered the environment at a different point than their stated origin, especially those of a very distant provenance such as Korea, China, Brazil or Argentina. Interestingly, there were fewer items from very distant regions. If oceans currents carried items from those distant regions to the Arctic, transport could take a long time (van Sebille et al., 2012; Strand et al., 2021). However, these items could also have been bunkered in countries other than their imprinted provenance. They could stem from ships, that travel to the Arctic from which debris enters the ocean and then washes ashore (Ryan et al., 2021), from cruise ships that frequent both Polar Regions or from international ship crews.
4.4.1. Date prints
It is possible to interpret the age of debris from production or expiration date on them (Sander, 2016). The time period between production date and date of disposal is still highly variable in these cases (Sander, 2016) but can give an indication about where an item has been discarded. The age of bottles combined with information of a local or foreign provenance can make the distinction between ship debris and long-distance drift (Ryan et al., 2021). Since the most recent date found was from a German shoe from 2012/2013, this method was not useful in determining how the debris ended up on Svalbard, as the estimated transport time for items from Europe is 1-2 years (van Sebille et al., 2016; Strand et al., 2021). By contrast, a French bottle with an expiration dating back less than a year would unlikely have drifted from France to Svalbard in one year but stem from local ship-based sources.
5. Conclusion
Beached debris was collected on the great majority of locations illustrating widespread pollution on Svalbard’s beaches. Citizen science thus helped to increase the temporal and spatial scale of observations in these remote under-researched regions. In terms of mass, most debris was related to fisheries, pointing to local sea-based sources and ship-related waste. In terms of debris counts, general plastic was most abundant, including packaging and plastic articles. They could stem from land- and sea-based sources alike. Comparison with data from the seafloor and sea surface indicates that Arctic beaches are accumulation areas for marine debris The provenance of items indicated that 65% stem from nearby Arctic countries (local sources) and 30% from European sources. The effects of global heating, such as a decline in sea ice extent and shorter periods of sea ice coverage (Polasek et al., 2017), lead to a prolonged period for ships operating in the Arctic as well as ships extending their range higher north (Stocker et al., 2020; Bergmann et al., 2022b). Given projected growth trajectories in global plastic production (Geyer, 2020), a further increase of plastic pollution from both local and distant sources could be prevented through a legally binding global Plastics Treaty with upstream measures such as caps on global plastic production, improved waste management and harbor schemes (Bergmann et al., 2022a; Bergmann et al., 2022b). Adequate policing of waste management policies regarding fishing vessels and environmental education and awareness is important as well. This in turn would reduce the amount of debris entering the ocean and would lift the stress on Arctic biota, which are already threatened by the effects of temperatures rising four times faster than the global average (Rantanen et al., 2022).
Data availability statement
The original contributions presented in the study are included in the article/Supplementary Material. Further inquiries can be directed to the corresponding author.
Author contributions
MB and BL contributed to conception and design of the study. BL executed taking samples, recording data and organized citizen scientists. AM and MB performed the statistical analysis. AM organized the database and wrote the first draft of the manuscript. All authors contributed to the article and approved the submitted version.
Funding
MB was funded by the Helmholtz Association, and this study contributes to the tasks of the Helmholtz-funded programme FRAM (Frontiers in Arctic Marine Research).
Acknowledgments
The authors gratefully acknowledge the support of the involved expedition cruise operators Cape Race Corporation, Tallship Company and Oceanwide Expeditions, the crews and expedition staffs of MS Cape Race, SV Antigua, MV Plancius, SV Rembrandt van Rijn and SV Noorderlicht for technical support, disposal of the collected debris and carrying out polar bear watches. We also thank all tourists who collected, sorted and weighed debris on the beaches of Spitsbergen during their holidays and expedition leaders M. van Dijk and F. Kruse for supporting and carrying out clean-ups.
Conflict of interest
The authors declare that the research was conducted in the absence of any commercial or financial relationships that could be construed as a potential conflict of interest.
Publisher’s note
All claims expressed in this article are solely those of the authors and do not necessarily represent those of their affiliated organizations, or those of the publisher, the editors and the reviewers. Any product that may be evaluated in this article, or claim that may be made by its manufacturer, is not guaranteed or endorsed by the publisher.
Supplementary material
The Supplementary Material for this article can be found online at: https://www.frontiersin.org/articles/10.3389/fmars.2023.1092939/full#supplementary-material
References
Aceves-Bueno E., Adeleye A. S., Feraud M., Huang Y., Tao M., Yang Y., et al. (2017). The accuracy of citizen science data a quantitative review. Bull. Ecol. Soc. America 98 (4), 278–290. doi: 10.1002/bes2.1336
Ammendolia J., Walker T. R. (2022). Citizen science: A way forward in tackling the plastic pollution crisis during and beyond the COVID-19 pandemic. Sci. Total Environ. 805. doi: 10.1016/j.scitotenv.2021.149957
Ansari M., Farzadkia M. (2022). Beach debris quantity and composition around the world: A bibliometric and systematic review. Mar. pollut. Bull. 178, 113637. doi: 10.1016/j.marpolbul.2022.113637
Bergmann M., Almroth B. C., Brander S. M., Dey T., Green D. S., Gundogdu S., et al. (2022a). A global plastic treaty must cap production. Science 376 (6592), 469–470. doi: 10.1126/science.abq0082
Bergmann M., Collard F., Fabres J., Gabrielsen G. W., Provencher J. F., Rochman C. M., et al. (2022b). Plastic pollution in the Arctic. Nat. Rev. Earth Environ 3, 328–330. doi: 10.1038/s43017-022-00279-8
Bergmann M., Klages M. (2012). Increase of litter at the Arctic deep-sea observatory HAUSGARTEN. Mar. pollut. Bull. 64 (12), 2734–2741. doi: 10.1016/j.marpolbul.2012.09.018
Bergmann M., Lutz B., Tekman M. B., Gutow L. (2017a). Citizen scientists reveal: Marine litter pollutes Arctic beaches and affects wild life. Mar. pollut. Bull. 125 (1-2), 535–540. doi: 10.1016/j.marpolbul.2017.09.055
Bergmann M., Sandhop N., Schewe I., D’Hert D. (2016). Observations of floating anthropogenic litter in the barents Sea and fram strait, Arctic. Polar Biol. 39 (3), 553–560. doi: 10.1007/s00300-015-1795-8
Bergmann M., Tekman M. B., Gutow L. (2017b). Marine litter: sea change for plastic pollution. NatureNature 544, 297. doi: 10.1038/544297a
Borrelle S. B., Ringma J., Law K. L., Monnahan C. C., Lebreton L., McGivern A., et al. (2020). Predicted growth in plastic waste exceeds efforts to mitigate plastic pollution. Science 369 (6505), 4. doi: 10.1126/science.aba3656
Buhl-Mortensen L., Buhl-Mortensen P. (2017). Marine litter in the Nordic seas: Distribution composition and abundance. Mar. pollut. Bull. 125 (1), 260–270. doi: 10.1016/j.marpolbul.2017.08.048
Collard F., Ask A. (2021). Plastic ingestion by Arctic fauna: A review. Sci. Total Environ. 786, 2–8. doi: 10.1016/j.scitotenv.2021.147462
Fleet D., Vlachogianni T., Hanke G. (2021). A joint list of litter categories for marine macrolitter monitoring, EUR 30348 EN (Luxembourg: Publications Office of the European Union). doi: 10.2760/127473
Falk-Andersson J. (2021). Beach litter deep dives-a method for improved understanding of sources of and behaviour behind littering. Mar. pollut. Bull. 167, 7. doi: 10.1016/j.marpolbul.2021.112346
Fauchald P., Arneberg P., Debernard J. B., Lind S., Olsen E., Hausner V. H. (2021). Poleward shifts in marine fisheries under Arctic warming. Environ. Res. Lett. 16 (7), 6. doi: 10.1088/1748-9326/ac1010
Garcia E. G. (2007). “The northern shrimp (Pandalus borealis) offshore fishery in the northeast Atlantic,” in Advances in marine biology (Elsevier: Academic Press), 147–266.
Geyer R. (2020). “A brief history of plastics,” in Mare plasticum - the plastic Sea: Combatting plastic pollution through science and art. Eds. Streit-Bianchi M., Cimadevila M., Trettnak W. (Cham: Springer International Publishing), 31–47.
Grøsvik B. E., Prokhorova T., Eriksen E., Krivosheya P., Horneland P. A., Prozorkevich D. (2018). Assessment of marine litter in the barents Sea, a part of the joint Norwegian–Russian ecosystem survey. Front. Mar. Sci. 5. doi: 10.3389/fmars.2018.00072
Haarr M. L., Falk-Andersson J., Fabres J. (2022). Global marine litter research 2015–2020: Geographical and methodological trends. Sci. Total Environ. 820, 153162. doi: 10.1016/j.scitotenv.2022.153162
Hartley B. L., Thompson R. C., Pahl S. (2015). Marine litter education boosts children’s understanding and self-reported actions. Mar. pollut. Bull. 90 (1), 209–217. doi: 10.1016/j.marpolbul.2014.10.049
Hidalgo-Ruz V., Thiel M. (2015). “The contribution of citizen scientists to the monitoring of marine litter,” in Marine anthropogenic litter. Eds. Bergmann M., Gutow L., Klages M. (Cham: Springer International Publishing), 429–447.
Institute, N.P TopoSvalbard. Available at: https://toposvalbard.npolar.no.
Isobe A., Iwasaki S. (2022). The fate of missing ocean plastics: Are they just a marine environmental problem? Sci. Total Environ. 825, 153935. doi: 10.1016/j.scitotenv.2022.153935
Jaskólski M. W., Pawlowski Ł., Strzelecki M. C., Zagórski P., Lane T. P. (2018). Trash on Arctic beach: Coastal pollution along calypsostranda, bellsund, Svalbard. Polish Polar Res. 39 (2), 211–224. doi: 10.24425/118746
Kylin H. (2020). Marine debris on two Arctic beaches in the Russian far East. Polar Res. 39, 6. doi: 10.33265/polar.v39.3381
Lavers J. L., Bond A. L. (2017). Exceptional and rapid accumulation of anthropogenic debris on one of the world's most remote and pristine islands. Proc. Natl. Acad. Sci. 114 (23), 6052–6055. doi: 10.1073/pnas.1619818114
Lavers J. L., Rivers-Auty J., Bond A. L. (2021). Plastic debris increases circadian temperature extremes in beach sediments. J. Hazard Mater 416, 126140. doi: 10.1016/j.jhazmat.2021.126140
Lebreton L., Royer S.-J., Peytavin A., Strietman W. J., Smeding-Zuurendonk I., Egger M. (2022). Industrialised fishing nations largely contribute to floating plastic pollution in the north pacific subtropical gyre. Sci. Rep. 12 (1), 12666. doi: 10.1038/s41598-022-16529-0
Locritani M., Merlino S., Abbate M. (2019). Assessing the citizen science approach as tool to increase awareness on the marine litter problem. Mar. pollut. Bull. 140, 320–329. doi: 10.1016/j.marpolbul.2019.01.023
Mallory M. L., Baak J., Gjerdrum C., Mallory O. E., Manley B., Swan C., et al. (2021). Anthropogenic litter in marine waters and coastlines of Arctic Canada and West Greenland. Sci. Total Environ. 783, 8. doi: 10.1016/j.scitotenv.2021.146971
Misund O. A., Heggland K., Skogseth R., Falck E., Gjøsæter H., Sundet J., et al. (2016). Norwegian Fisheries in the Svalbard zone since 1980. regulations, profitability and warming waters affect landings. Polar Sci. 10 (3), 312–322. doi: 10.1016/j.polar.2016.02.001
Nelms S. E., Coombes C., Foster L. C., Galloway T. S., Godley B. J., Lindeque P. K., et al. (2017). Marine anthropogenic litter on British beaches: A 10-year nationwide assessment using citizen science data. Sci. Total Environ. 579, 1399–1409. doi: 10.1016/j.scitotenv.2016.11.137
Onink V., Jongedijk C. E., Hoffman M. J., van Sebille E., Laufkötter C. (2021). Global simulations of marine plastic transport show plastic trapping in coastal zones. Environ. Res. Lett. 16 (6), 064053. doi: 10.1088/1748-9326/abecbd
Onink V., Wichmann D., Delandmeter P., van Sebille E. (2019). The role of ekman currents, geostrophy, and stokes drift in the accumulation of floating microplastic. J. Geophys Res. Oceans 124 (3), 1474–1490. doi: 10.1029/2018JC014547
Panayotova M. D., Bekova R. I., Stefanova K. B., Todorova V. R., Gumus M. R., Slabakova V. H., et al. (2020). Seasonal composition and density of marine litter on asparuhovo beach, varna, Bulgaria. Ecologica Balkanica (3), 85–94.
Parga Martínez K. B., Tekman M. B., Bergmann M. (2020). Temporal trends in marine litter at three stations of the HAUSGARTEN observatory in the Arctic deep Sea. Front. Mar. Sci. 7. doi: 10.3389/fmars.2020.00321
Persson L., Carney Almroth B. M., Collins C. D., Cornell S., de Wit C. A., Diamond M. L., et al. (2022). Outside the safe operating space of the planetary boundary for novel entities. Environ. Sci. Technol. 56 (3), 1510–1521. doi: 10.1021/acs.est.1c04158
Pogojeva M., Zhdanov I., Berezina A., Lapenkov A., Kosmach D., Osadchiev A., et al. (2021). Distribution of floating marine macro-litter in relation to oceanographic characteristics in the Russian Arctic seas. Mar. pollut. Bull. 166, 9. doi: 10.1016/j.marpolbul.2021.112201
Polasek L., Bering J., Kim H., Neitlich P., Pister B., Terwilliger M., et al. (2017). Marine debris in five national parks in Alaska. Mar. pollut. Bull. 117 (1-2), 371–379. doi: 10.1016/j.marpolbul.2017.01.085
Pörtner H.-O., Roberts D. C., Tignor M., Poloczanska E. S., Mintenbeck K., Alegría A., et al. (2022). “IPCC 2022: Climate change 2022,” in Impacts, adaptation, and vulnerability. contribution of working group II to the sixth assessment report of the intergovernmental panel on climate change (Cambridge, UK and New York, NY, USA: Cambridge University Press. Cambridge University Press).
Primpke S., Cross R. K., Mintenig S. M., Simon M., Vianello A., Gerdts G., et al. (2020). Toward the systematic identification of microplastics in the environment: Evaluation of a new independent software tool (siMPle) for spectroscopic analysis. Appl. Spectrosc 74 (9), 1127–1138. doi: 10.1177/0003702820917760
Provencher J. F., Aliani S., Bergmann M., Bourdages M., Buhl-Mortensen L., et al. (2021). Future monitoring of litter and microplastics in the Arctic—challenges, opportunities, and strategies. Arctic Sci. doi: 10.1139/as-2022-0011
Araźny A., Kejna M., Maszewski R., Przybylak R. (2012). “Introduction, in: Topoclimatic diversity in the forlandsundet region (Nw spitsbergen),” in Global warming conditions, vol. 2012 . Ed. Przybylak R., Araźny A., Kejna M. (Nicolaus Copernicus University), 7–25.
Rantanen M., Karpechko A. Y., Lipponen A., Nordling K., Hyvärinen O., Ruosteenoja K., et al. (2022). The Arctic has warmed nearly four times faster than the globe since 1979. Commun. Earth Environ. 3 (1), 168. doi: 10.1038/s43247-022-00498-3
Richardson K., Hardesty B. D., Vince J., Wilcox C. (2022). Global estimates of fishing gear lost to the ocean each year. Sci. Adv. 8 (41), eabq0135. doi: 10.1126/sciadv.abq0135
Ryan P. G., Dilley B. J., Ronconi R. A., Connan M. (2019). Rapid increase in Asian bottles in the south Atlantic ocean indicates major debris inputs from ships. Proc. Natl. Acad. Sci. U.S.A. 116 (42), 20892–20897. doi: 10.1073/pnas.1909816116
Ryan P. G., Weideman E. A., Perold V., Hofmeyr G., Connan M. (2021). Message in a bottle: Assessing the sources and origins of beach litter to tackle marine pollution. Environ. pollut. 288, 117729. doi: 10.1016/j.envpol.2021.117729
Ryan P. G., Weideman E. A., Perold V., Moloney C. L. (2020). Toward balancing the budget: Surface macro-plastics dominate the mass of particulate pollution stranded on beaches. Front. Mar. Sci. 7. doi: 10.3389/fmars.2020.575395
Sander L. (2016). Date-prints on stranded macroplastics: Inferring the timing and extent of overwash deposition on the skallingen peninsula, Denmark. Mar. pollut. Bull. 109 (1), 373–377. doi: 10.1016/j.marpolbul.2016.05.051
Stocker A. N., Renner A. H. H., Knol-Kauffman M. (2020). Sea Ice variability and maritime activity around Svalbard in the period 2012-2019. Sci. Rep. 10 (1), 12. doi: 10.1038/s41598-020-74064-2
Stokstad E. (2022). United nations to tackle global plastics pollution. Science 375, 801–802. doi: 10.1126/science.ada1551
Strand K. O., Huserbraten M., Dagestad K. F., Mauritzen C., Grosvik B. E., Nogueira L. A., et al. (2021). Potential sources of marine plastic from survey beaches in the Arctic and northeast Atlantic. Sci. Total Environ. 790, 148009. doi: 10.1016/j.scitotenv.2021.148009
Svendsen H., Beszczynska-Møller A., Hagen J. O., Lefauconnier B., Tverberg V., Gerland S., et al. (2002). The physical environment of kongsfjorden–krossfjorden, an Arctic fjord system in Svalbard. Polar Res. 21 (1), 133–166. doi: 10.1111/j.1751-8369.2002.tb00072.x
Tekman M. B., Gutow L., Bergmann M. (2022a). Marine debris floating in Arctic and temperate northeast Atlantic waters. Front. Mar. Sci. 9. doi: 10.3389/fmars.2022.933768
Tekman M. B., Gutow L., Bergmann M., Peter C. (2022b) Litterbase. Available at: https://litterbase.awi.de.
Tekman M. B., Krumpen T., Bergmann M. (2017). Marine litter on deep Arctic seafloor continues to increase and spreads to the north at the HAUSGARTEN observatory. Deep Sea Res. Part I: Oceanographic Res. Papers 120, 88–99. doi: 10.1016/j.dsr.2016.12.011
Tekman M. B., Waltherm B. A., Peter C., Gutow L., Bergmann M. (2022c). Impacts of plastic pollution in the oceans on marine species, biodiversity and ecosystems (WWF Germany, Berlin). doi: 10.5281/zenodo.5898684
Tekman M. B., Wekerle C., Lorenz C., Primpke S., Hasemann C., Gerdts G., et al. (2020). Tying up loose ends of microplastic pollution in the Arctic: Distribution from the Sea surface through the water column to deep-Sea sediments at the HAUSGARTEN observatory. Environ. Sci. Technol. 54 (7), 4079–4090. doi: 10.1021/acs.est.9b06981
Thompson R. C., Olsen Y., Mitchell R. P., Davis A., Rowland S. J., John A. W. G., et al. (2004). Lost at Sea: Where is all the plastic? Science 304 (5672), 838–838. doi: 10.1126/science.1094559
Topçu E. N., Tonay A. M., Dede A., Öztürk A. A., Öztürk B. (2013). Origin and abundance of marine litter along sandy beaches of the Turkish Western black Sea coast. Mar. Environ. Res. 85, 21–28. doi: 10.1016/j.marenvres.2012.12.006
van Gool E., Campbell M., Wallace P., Hewitt C. L. (2021). Marine debris on new Zealand beaches - baseline data to evaluate regional variances. Front. Environ. Sci. 9. doi: 10.3389/fenvs.2021.700415
van Sebille E., England M. H., Froyland G. (2012). Origin, dynamics and evolution of ocean garbage patches from observed surface drifters. Environ. Res. Lett. 7, 1–6. doi: 10.1088/1748-9326/7/4/044040
van Sebille E., Spathi C., Gilbert A. (2016). The ocean plastic pollution challenge: towards solutions in the UK (Imperial College London, Grantham Insitute).
Vesman A., Moulin E., Egorova A., Zaikov K. (2020). Marine litter pollution on the northern island of the novaya zemlya archipelago. Mar. pollut. Bull. 150, 110671. doi: 10.1016/j.marpolbul.2019.110671
Walther B. A., Kunz A., Hu C.-S. (2018). Type and quantity of coastal debris pollution in Taiwan: A 12-year nationwide assessment using citizen science data. Mar. pollut. Bull. 135, 862–872. doi: 10.1016/j.marpolbul.2018.08.025
Waluda C. M., Staniland I. J., Dunn M. J., Thorpe S. E., Grilly E., Whitelaw M., et al. (2020). Thirty years of marine debris in the southern ocean: Annual surveys of two island shores in the Scotia Sea. Environ. Int. 136, 105460. doi: 10.1016/j.envint.2020.105460
Wassmann P., Slagstad D., Ellingsen I. (2019). Advection of mesozooplankton into the northern Svalbard shelf region. Front. Mar. Sci. 6. doi: 10.3389/fmars.2019.00458
Keywords: abandoned lost or otherwise discarded fishing gear, Arctic, beach debris, citizen science, derelict fishing gear, marine litter, plastic pollution, Polar Regions
Citation: Meyer AN, Lutz B and Bergmann M (2023) Where does Arctic beach debris come from? Analyzing debris composition and provenance on Svalbard aided by citizen scientists. Front. Mar. Sci. 10:1092939. doi: 10.3389/fmars.2023.1092939
Received: 08 November 2022; Accepted: 05 January 2023;
Published: 07 February 2023.
Edited by:
Mario Barletta, Federal University of Pernambuco, BrazilReviewed by:
Sarah Nelms, University of Exeter, United KingdomGiuseppe Suaria, Department of Earth System Sciences and Technologies for the Environment (CNR), Italy
Copyright © 2023 Meyer, Lutz and Bergmann. This is an open-access article distributed under the terms of the Creative Commons Attribution License (CC BY). The use, distribution or reproduction in other forums is permitted, provided the original author(s) and the copyright owner(s) are credited and that the original publication in this journal is cited, in accordance with accepted academic practice. No use, distribution or reproduction is permitted which does not comply with these terms.
*Correspondence: Melanie Bergmann, Melanie.Bergmann@awi.de